

Private: Learning Math: Patterns, Functions, and Algebra
Proportional Reasoning Part C: Quadperson (45 minutes)
Session 4, Part C
In This Part
- Playing with Quadperson
- Analyzing the Results
- Graphs of Proportional Relationships
Playing with Quadperson
This activity compares the effects of absolute and relative comparisons on a picture. Think about what would happen to a drawing if every line were made half as long. Would it look like the same picture at all? What would happen if you made every line a half-inch shorter? In this activity, you will see the effects of these changes on Quadperson, a drawing of a face made of quadrilaterals.

(one grid = 1/2 inch)
On a piece of graph paper, draw a picture of Quadperson so that each line in your drawing is half as long as the corresponding line in the picture above. Then, make another picture of Quadperson so that each line in your drawing is a half-inch less in length as the corresponding line in the original Quadperson.
Problem C1
Compare the “before” and “after” quadperson when you multiplied each length by one-half.
Problem C2
Compare the “before” and “after” quadperson when you subtracted half an inch from each length.
Problem C3
Of Problems C1 and C2, which is a relative comparison? Which is an absolute comparison? Explain how you know.
Problem C4
Did the Quadperson look the same after a change made by an absolute comparison? Did the Quadperson look the same after a change made by a relative comparison? Why?
| Video Segment
In this video segment, Andrea and Deanna compare the two versions of Quadperson and discuss why one Quadperson is more in proportion with the original than the other. Watch this segment after you’ve completed Problems C1-C4, and reflect on the onscreen participants’ reasoning about the results of their drawings. Would every absolute comparison change the shape of Quadperson? You can find this segment on the session video, approximately 5 minutes and 58 seconds after the Annenberg Media logo. |
| Video Segment
In this video segment, the onscreen participants discover the proportional change in area determined by the relative change in Quadperson. Can you explain why the two-dimensional area would change in the manner described in this segment? This topic will be further explored in the “Measurement” course. You can find this segment on the session video, approximately 8 minutes and 41 seconds after the Annenberg Media logo. |
Analyzing the Results
Let’s try to generalize our results from the two ways of creating a new Quadperson. Note 7
Problem C5
Let y1 be a function that takes an input x (the length of a line segment) and outputs the segment’s length as described by Problem C1. Write a formula for y1.
Tip: If x is the input, describing a rule to determine the output will help you find the formula.
Problem C6
Let y2 be a function that takes an input x (the length of a line segment) and outputs the segment’s length as described by Problem C2. Write a formula for y2.
Problem C7
Graph the functions you created in Problems C5 and C6. Describe any similarities or differences in the graphs.
Tip: One way to make these graphs is to create a table of values for each function, then plot and connect the points on each graph.
A relationship is proportional if the ratio of inputs and outputs is the same for all inputs and outputs. This kind of relationship is also sometimes referred to as direct variation.
Problem C8
Look at the graphs you created in Problems C5 and C6. Use the graphs to decide whether or not either function represents a proportional relationship.
|
Video Segment In this video segment, the onscreen participants compare the graphs in Problem C7 and use the graphs to explain their observations about quadperson. Watch this segment after you have completed Problems C5-C8 and compare your observations about the graphs with those of the onscreen participants. Would the graphs of two different proportional relationships intersect? Where? You can find this segment on the session video, approximately 14 minutes and 34 seconds after the Annenberg Media logo. |
Graphs of Proportional Relationships
Problem C9
Draw a third picture of Quadperson, so that each line in this new drawing is double the length of the original corresponding line.
Problem C10
Describe this relationship with a table and an equation.
Problem C11
How do you know that the graph you made in Problem C10 represents a proportional relationship? What does this graph have in common with others that you have drawn?
Problem C12
What conclusions can you draw about the graphs of proportional relationships? Explain how you could determine whether or not a line graph represents a proportional relationship.
Notes
Note 6
Groups: Work in pairs on the Quadperson Interactive Activity. One person should do Problem C1 and one should try Problem C2.
After completing the Interactive Activity, consider which of the new Quadpersons looks more like the original Quadperson, and why. Discuss this in pairs and as a whole group. Explore which line segment drawn in Problem C2 was most dramatically affected by cutting half an inch of the length. In fact, it is the rectangle “nose” that becomes a line segment. Relative to the length of this segment, cutting off half an inch had a dramatic effect.
What would have happened if the original rectangle nose had been a mile long? What effect would cutting off half an inch have had then? Which line segment was most dramatically affected in Problem C1 by taking half its length?
Note 7
Groups: Work on Problems C5-C8 in pairs or small groups. In these problems, create line segments that illustrate the effect of the two techniques. Notice that the graph for y2= (1/2)x represents a proportional relationship; that is, when x doubles, y doubles. This is also known as direct variation. The ratio of any two pairs of coordinates is always the same.
Notice that although this line passes through the origin (as does any graph of a proportional relationship), the graph for situation B — y1 = x + 1/2 — does not.
Solutions
Problem C1
The “after” Quadperson has the same scale to its facial features; the nose is still four times as wide as it is tall, and so forth.
Problem C2
This “after” Quadperson does not have the same shape as the original. In particular, the nose becomes a flat line, but other features are scaled differently from “before.”
Problem C3
Problem C1 is the relative comparison. Think about the angles and measurements in the body; we expect, for example, the head to be a certain fraction of the size of the torso, and so forth.
Problem C4
The change in Problem C1, a relative comparison, keeps these measurements in proportion, while the change in Problem C2, an absolute comparison, does not. In Problem C2, short lengths are made way too short (the nose, for example) by giving an absolute change in length, rather than a proportional change in length.
Problem C5
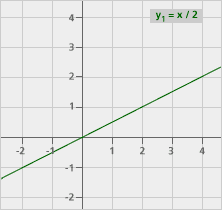
y1 = x/2.
Problem C6
y2 = x – 1/2.
Problem C7
Both graphs are straight lines. The graph of y1 goes through the origin (0, 0), while the graph of y2 does not. Additionally, the graph of y2 becomes negative if x < 1/2, not a good thing when measuring lengths.
| a.
|
b.
|
Problem C8
Yes, the graph of y1 is proportional, since the input is always twice the output. Or, the output is half the input. (Compare that to the formula y1 = x / 2.) The graph of y2 is not proportional; try finding the outputs for two different values of x, then determine if they are proportional. This produces the different shape of Quadperson in Problem C2.
Problem C9

Note: Not drawn to the same scale as Quadperson activity.
Problem C10
The equation for this table is y3 = 2x.
|
|||||||||||||||||||||||||||
Problem C11
It is a proportional relationship because every output is twice the input, and if we multiply the input by any number, we multiply the output by the same number. This graph, like the last proportional graph, passes through the origin (0, 0).
Problem C12
All proportional relationships have the equation y = kx, where k is some constant number. A line graph represents a proportional relationship only when the line goes through the origin (0, 0).