Join us for conversations that inspire, recognize, and encourage innovation and best practices in the education profession.
Available on Apple Podcasts, Spotify, Google Podcasts, and more.
Thinking algebraically helps us to develop different ways of representing real-world situations. You may have chosen to use a table to represent the situation with Eric the Sheep, for example, or you may have tried to describe the process in words or as an equation. Representations of mathematical ideas enable us to use mathematics as a way of communicating with others. Note 6
The next set of problems involves qualitative graphs, representations that focus on the important general features of a situation. Looking at qualitative graphs helps us to make sense of a situation and allows us to make predictions and draw conclusions. In this way, even a simple qualitative graph can communicate a great deal of information.
Making sense of graphs and drawing conclusions from them make it possible for us to understand our world and the information around us. If you look at a newspaper, a financial report, or virtually any statistical information, you’ll find a graph. The ability to interpret these graphs is essential to understanding the information contained within it. Note 7
Problem C1
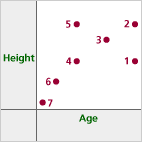
Look at the graph below. Who is represented by each point?

Tip: Don’t worry that there are no numbers on the axes. This helps you focus on the representation and its meaning rather than just a picture of the situation.
Problem C2
What would the graph for this problem look like with the axes reversed?
Problem C3
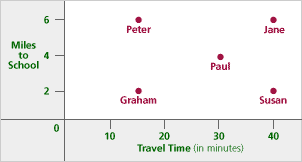
Jane, Graham, Susan, Paul, and Peter all travel to school along the same country road every morning. Peter goes in his dad’s car, Jane cycles, and Susan walks. The other two children vary how they travel from day to day. The map below shows where each person lives. Note 8
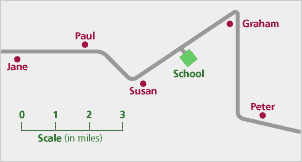
The following graph describes each pupil’s journey to school last Monday.
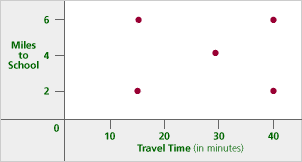
Tip: Ask yourself which students correspond to particular values on each axis for time and distance.
Problem C4
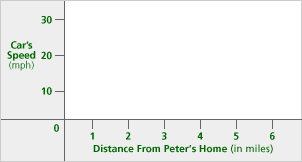
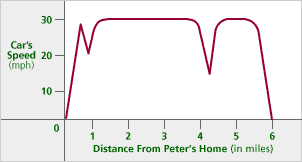
Peter’s father is able to drive at 30 mph on the straight section of the road, but he has to slow down for the corners. Sketch a graph on the axes below to show how the car’s speed varies along the route.
Problem C5
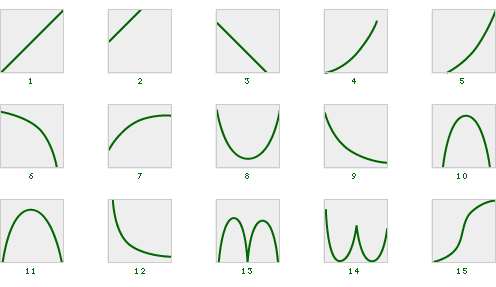
Often we are asked to sketch graphs from words or descriptions. Choose the best graph to fit each of the situations described below. Note 10
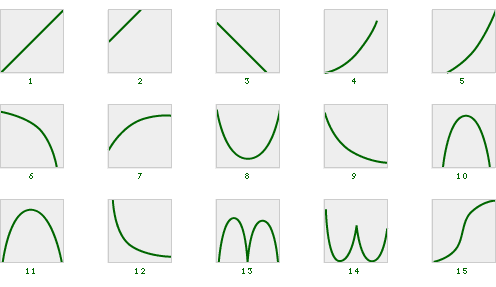
Tip: At each important place on the graph, think about whether the values in the graph should be increasing more rapidly, increasing but slowing down, remaining steady, decreasing but leveling off, or decreasing more rapidly. Additionally, the graph should reflect important changes in the real-world situation and the starting position of the graph (where it touches the axes).
|
Video Segment One group selected graph number 11 as its answer. How could you defend this choice? How did the group label the axes? You can find this segment on the session video, approximately 19 minutes and 44 seconds after the Annenberg Media logo. |
Problem C6
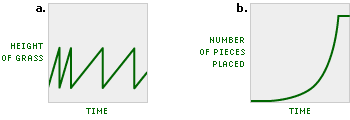
In the following real-world situations, decide what happens. Explain each situation carefully in words, and then choose the graph that best represents the situation, as in Problem C5.
Tip: As in Problem C5, consider carefully where the graph should begin, whether it should increase or decrease, and how quickly.
Problem C7
Draw the graphs to illustrate the following statements. Label your axes with the variables they represent.
Take It Further: Problem C8
Choose at least three of the situations in Problems C5-C7, and change the conditions in a way that alters the graph of the situation. Then, draw the new graphs.
Problem C9
| a. | Did you ever notice that when filling some bottles, the water all of a sudden spurts out of the top? Why does this happen? |
| b. | Imagine filling each of the six bottles below, pouring water in at a constant rate. For each bottle, choose the correct graph, relating the height of the water to the volume of water that’s been poured in. |
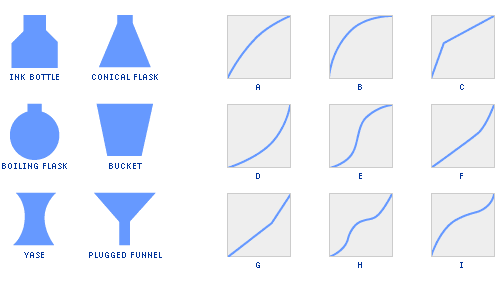
| c. | For the remaining three graphs, sketch what the bottles should look like. |
Note 11
Tip: When will the graph of a bottle’s height increase most slowly? Most rapidly?
Note 6
One of the goals of thinking algebraically is to develop different ways of representing real-world situations. Representing mathematical ideas in pictures, tables, graphs, and words allows us to use mathematics as a way of communicating. With Eric the Sheep, it appeared that a table and a description in words were good representations of the situation.
The problems in this section involve qualitative graphs. These are graphs that concentrate on the general features of a real-world situation. As an analogy, when learning a foreign language, we are given the rules of grammar, but also opportunities to express ourselves. Similarly, qualitative graphs allow us to interpret, transform, predict, and make logical deductions from the given mathematical data. In this way, even simple graphs can communicate a great deal of information, as illustrated in Problem C1.
Note 7
Groups: Work in pairs on Problem C1. All of the graphing activities in this section lend themselves to interesting and thoughtful discourse, so it’s important to allow time for everyone to discuss their own reasoning and justify their answers.
It may seem puzzling at first that there are no numbers on any of the graphs’ axes. This may be especially true for those who are accustomed to teaching precise point-plotting techniques. Consider why the axes are not labeled with values. (In fact, if there were numbers on the axes, we would not have to think about the relative positions of the points.) The graph in Problem C1 is particularly interesting because height is not on the vertical axis. This is intentional so that, once again, we have to focus on the representation and its meaning rather than on a graph that is merely a literal picture of the situation. Consider creating another graph for Problem C2, one with the axes reversed.
Note 8
Groups: Record answers to Problem C3 on an overhead or chalkboard. It is important to describe carefully the reasoning that was used to place the specific points on the graph.
Note 9
The reasoning of Problem C4 (to determine what must be true of Jane, Paul, and Graham) is sophisticated, and it foreshadows the work we will be doing in later sessions on slope and rate. Session 4 notes
Note 10
Groups: Work on Problem C5 in small groups. For each description, compare answers. Be sure to explain the reasoning for selecting the associated graphs.
Note 11
It may be helpful to illustrate the relationship between volume and height for the bottles in Problem C9 by using a conical flask and a cylindrical bottle, and filling each with water at a steady rate. Or fill each one with cups of water and measure their heights after each cupful.
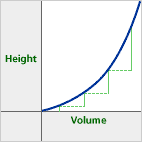
Groups: If anyone has difficulty seeing how this would translate to a graph, consider drawing a figure on an overhead or chalkboard to show the conical flask. For example, the height increases by a small amount to start with (so that bottle must be wide at the bottom) and then gradually rises by larger and larger amounts (so that bottle must be getting narrower gradually towards the top). Therefore, this is the graph of the conical flask:
Problem C1
1 = Dennis
2 = Alice
3 = Freda
4 = Brenda
5 = Errol
6 = Cathy
7 = Gavin
Problem C2
Problem C3
Problem C4
The graph begins at zero, climbs to (or near) 30 mph, slows down at the first turn, then stays at 30 mph for a long time, then slows at the sharp turn by Graham’s, then returns to 30 mph, then slowly drops back to zero at the school.
Problem C5
Problem C6

Problem C7
Problem C9
