
Private: Learning Math: Patterns, Functions, and Algebra
Nonlinear Functions Part A: Exploring Exponential Functions (40 minutes)
Session 7, Part A
In This Part
- Changing + to *
- Introduction to Exponential Functions
Problems: Changing + to *
In Session 5, we learned that linear functions have constant first differences. That is, every time x increases by 1, y increases by a constant amount. In this section, we will come up with a description for another type of function: exponential functions. Note 2
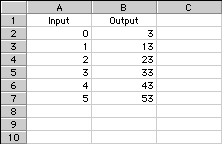
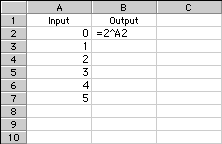
Here’s a table generated by a spreadsheet. The rule in the Output column is recursive: Start at 3 and add 10 each time. Here are the values in the table:
If you need a refresher on how to use a spreadsheet, see the tutorial in Session 5.
To generate this table in a spreadsheet using formulas, type the number “3” in cell B2, then type “=B2+10” in cell B3. Use the “Fill Down” menu command to continue the rule to cell B7.
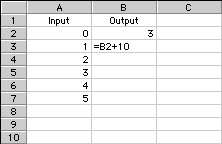
Remember that the value in a cell is what is displayed, but the formula is used to generate the value. Click on cell B4 (the cell containing “23”) to see the rule that generates the table: “=B3+10”. You also could have used a formula to generate the values in column A.
Because the successive outputs have a constant difference of 10, these points should all lie on a line.
Problem A1
Use the spreadsheet to graph this table, then verify that all the points lie on the same line. Note 3
Tip: If you’re having trouble making a graph, see the spreadsheet tutorial about graphing.
Problem A2
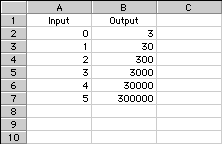
Click on cell B3 again, and change the + to * in the output rule. The rule should now read: “=B2*10”, and you should see the value “30” displayed in the cell after you enter the new formula. Now use the “Fill Down” command to copy the rule into the rest of the Output column.
If you have done this correctly, the final value in cell B7 should be 300,000.
Describe the pattern of outputs in your spreadsheet.
Tip: Use the recursive rule to describe the table.
Problem A3
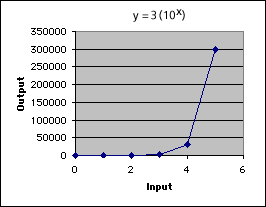
Graph this table. Describe the graph
Take It Further
Problem A4
Predict how much higher the input would have to be for the output to be more than 1 billion. Then use the spreadsheet to find the answer.
Problem A5
Let’s make another small change to the formulas on our spreadsheet and see how this change affects our graph. Click on cell B3 again, and change the * to / in the output rule. The rule should now read: “=B2/10”, and you should see the value “0.3” displayed in the cell after you’ve entered the new formula. Now, use the “Fill Down” command to copy the rule into the rest of the Output column.
Describe the pattern of outputs in your spreadsheet.
Problem A6
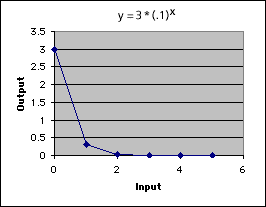
Graph this table. Describe the graph.
Problem A7
Think about the two new tables you created in Problems A2 and A5. For each table, list three numbers that will never appear in the Output column, and then explain why they will never appear there.
Tip: Can you find any types of numbers that will never appear in the Output column?
Introduction to Exponential Functions
It’s amazing how different the three tables and graphs presented in Problems A1-A7 are, and all you did was change a “+” to a “*”, then a “*” to a “/”!
The changes we made to the spreadsheet may have seemed small, but each change made an enormous impact in the tables and graphs. When we changed the “+” to a “*”, we changed each output from a constant difference of 10 to a constant ratio of 10. This created a new type of rule called an exponential function, any function where each output is a constant multiple of the previous output.
Exponential functions often come up in real-world situations. The interest earned on an investment and the decay of nuclear waste are two good examples.
Before we move on, let’s take a few moments to think about exponential notation. Just as multiplication shows repeated addition, exponents show repeated multiplication. Here are a few examples so that you can see the parallels.
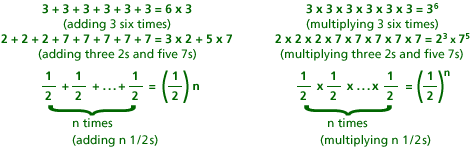
You may have noticed that one example in the table above shows repeated multiplication of a fraction. Since division by a constant whole number is equivalent to multiplying by a fraction, dividing by a constant multiple also creates exponential functions.
A few terms are handy to know when you’re talking about exponential functions. In the equation y = bx, b is called the base and x is called the exponent.
So far, the exponential functions we’ve created have used recursive rules: Each output is a multiple of the last output. As is true with linear functions, it’s often more useful to write an exponential function using a closed-form rule. To do this, we’ll need to use exponents.
The spreadsheet uses a ^ symbol to make exponents. Use the table below as a guide to set up the first spreadsheet of Problem A8. After typing in the rule, you should use the “Fill Down” command to copy it to the rest of the Output column.
Problem A8
Use a spreadsheet to investigate the graphs of exponential functions. For each output rule below, create an input/output table for the rule and then graph the function. Describe the graphs and how they vary for different bases, making sure to include parentheses around a fractional base when you enter these rules into a spreadsheet. Note 4
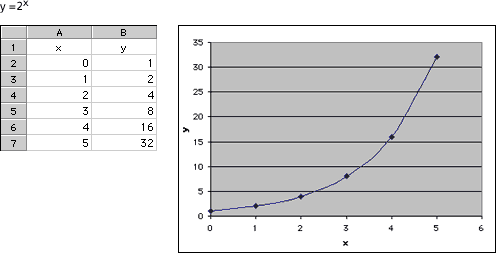
- y = 2x
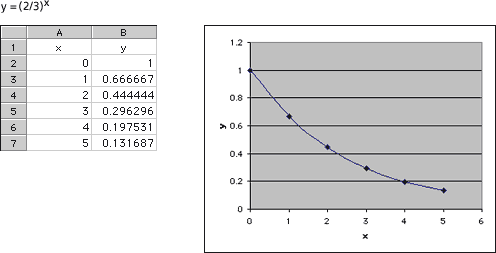
- y = (2/3)x
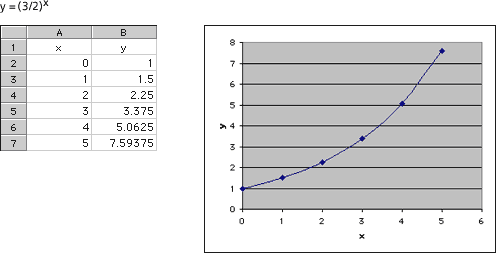
- y = (3/2)x
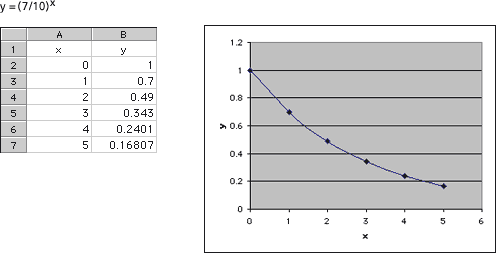
- y = (7/10)x
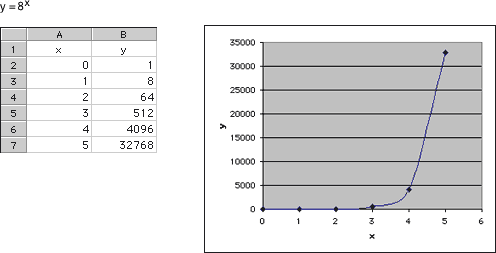
- y = 8x
- Make up one of your own to try.
Problem A9
Which of the graphs in Problem A8 were increasing? Which were decreasing? Explain how you could decide whether or not y = (4/5)x is increasing or decreasing without graphing it.
Tip: The recursive rule for y is very helpful here. What changes when x grows by 1?
| Video Segment
In this video segment, the class discusses the graphs of y = 2x and y = (2/3)x from Problem A8. They find rules to determine whether an exponential function will be increasing or decreasing. Watch this segment to review your work in Part A and to get a clearer understanding of why exponential functions are increasing or decreasing. Can you explain why the graph of y = (2/3)x is decreasing? You can find this segment on the session video, approximately 4 minutes and 45 seconds after the Annenberg Media logo |
Take It Further
Problem A10
Is there any exponential function that increases for a while, then decreases? Is there an exponential function that never increases or decreases?
Notes
Note 2
Groups: Work in pairs at the computer.
Start your spreadsheet program and create a worksheet. Remember the following tips:
- Click on a cell to see the function it contains displayed in the edit line above the worksheet.
- To edit the entry in a cell, click on the cell, highlight any characters that were already there, and type over them.
- To “fill down” (when you have a function used throughout a column of cells), highlight the cell you want to use as a starting point, then drag down to the cell you want to use as your ending point. Choose the Fill Down command to fill down.
- To create the graph of a function, highlight the input and output cells and click on the “chart” button. Go through the menus, using the first column as the inputs.
For the functions in this session, you may choose to connect the points with line segments or with smooth curves. Consider the benefits of each type of graph. A smooth curve might not make sense if the function is only defined by integer values, but it might help to see the graph more clearly.
Note 3
Remember to use the Fill Down command after changing the output rules. The graphs and tables will change automatically with any changes you make to the columns.
Groups: After completing Problems A1-A7, discuss your responses to Problem A7.
The tendency may be to answer Problem A7 with particular numbers. For example, the first table will never contain the output 2, because the table starts at 3 and then increases. Think also about what types of numbers will never appear. For example, unless you use negative inputs, the first table will never contain negative numbers, numbers less than 3, fractions, or numbers that aren’t multiples of 10 (except 3). Justify your claims. This will push you to think more deeply about exponential functions.
Groups: Before moving on, take a few minutes to read through the chart or put up an overhead of the chart. Take a moment to work a bit with the notation. For example, if you have a rule that is y = 10x, what would you get for x = 2? For x = 4?
Groups: You also may want to discuss zero as an exponent. Note that this is completely optional; knowledge of zero as an exponent is not assumed anywhere during the session. There are a couple of ways to explain the fact that any number (except zero) to the zero power is 1. First, discuss what 20 would mean and why. Then think about the following two explanations:
Multiplying by 1 doesn’t change anything, so you can think of powers of 2 (for example) as 1 times some number of 2s.
23 = 1 x 2 x 2 x 2 (1 times three 2s)
22 = 1 x 2 x 2 (1 times two 2s)
21 = 1 x 2 (1 times one 2)
20 = 1 (1 times zero 2s)
Alternately, look at decreasing powers of 2:
23 = 8
22 = 4
21 = 2
Each power is half the previous one, so if the pattern is to continue, it must be the case that 20 = (1/2) x 2 = 1. Extending this pattern can help you find the meaning of negative exponents, as well. It should be the case that 2-1 = (1/2) x 1 = 1/2, and in fact this is what negative exponents mean.
Think about why a closed-form rule like y = 3x would give rise to a table with a constant ratio between successive outputs. A possible explanation is that if the input increases by 1, then the product is multiplied by another 3, so each output will be 3 times the previous one.
Note 4
Create a new worksheet, and then work on Problem A8. As you make your own functions, experiment with interesting or strange cases: What if you use 1x? What about using a number close to 1? Or using very large or very small numbers? In some cases, the numbers get so big that the graphs are distorted between the input points. For example, this graph was created with the rule 100x. It does not look like a smooth, constantly increasing function. Surely it shouldn’t dip below the x-axis!
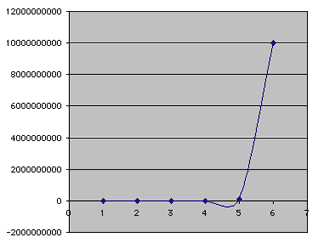
Groups: Discuss why this is a mistake, and why the software might do that.
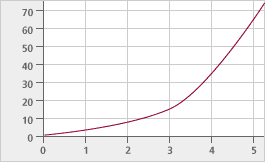
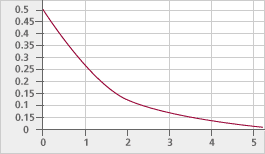
Before moving on, think about exponential functions and describe two different kinds. Some exponential functions — those with a base that is greater than 1 — are increasing (bigger inputs always produce bigger outputs, and the graph never slopes down), and others — those with a base less than 1 — are decreasing (bigger inputs always produce smaller outputs). The exception is 1, which produces a constant function that graphs as a line. Using numbers close to 1 as bases produce graphs that look like lines, but actually are not. Extending the graphs to more inputs better shows the behavior of the functions.
All exponential functions (except with a base of 1) have graphs like these:
 |
 |
Solutions
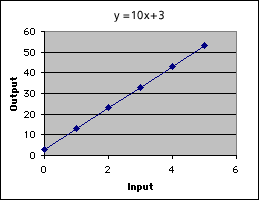
Problem A1
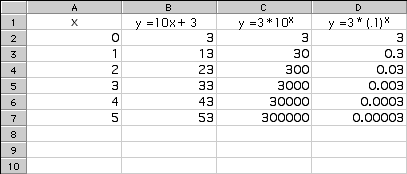
It is the line y = 10x + 3.
Problem A2
The outputs are: 3, 30, 300, 3,000, 30,000, and 300,000. In each, the input number is the number of zeros in the output. There is a constant ratio between each term. A recursive rule is to multiply by 10 each time to get the next output number.
Problem A3
The graph is increasingly steep as the input value grows, and successive values of the output dwarf all the others. The first output value, 3, is virtually impossible to see if we scale the graph to include the last output value, 300,000.
Problem A4
The input only needs to grow by 4 more to reach 1 billion. The input of 9 gives an output of 3 billion.
Problem A5
The outputs are: 3, 0.3, 0.03, 0.003, 0.0003, and 0.00003. In each, the input number is the number of digits to the right of the decimal point. Again, there is a constant ratio. A recursive rule is to divide by 10 each time to get the next output number.

Problem A6
The graph is similar to the graph in Problem A3, but in reverse: the graph is increasingly flat, and successive outputs are increasingly close to zero. The first output, 3, dwarfs the last output, which is 100,000 times smaller.
Problem A7
The output table can produce neither negative numbers nor zero unless the initial value were negative or zero. This happens because we are multiplying and dividing, step by step, by a positive number, and the only way to yield a negative or zero would be to start with a negative or zero. There are many other positive numbers that do not appear in the tables of Problems A2 and A5, including any number not starting with 3.
Problem A8
The graphs for y = 2x, y = (3/2)x, and y = 8x are increasing. The graph for y = 8x is the steepest graph, while y = 2x is steeper than y = (3/2)x.
The graphs for y = (2/3)x and y = (7/10)x are decreasing. The graph for y = (2/3)xdecreases a little faster than y = (7/10)x, but the graphs are much closer together than the increasing graphs. All five graphs pass through the point (0, 1).
Problem A9
The functions y = 2x, y = (3/2)x, and y = 8x were increasing. The functions y = (2/3)xand y = (7/10)x were decreasing. When the base is larger than 1, successive outputs will be larger, because we are multiplying to create a larger number. Additionally, the larger the base (greater than 1), the steeper the graph will be. When the base is between zero and 1, successive outputs will be smaller, since we are multiplying by a number less than 1. Additionally, the smaller the base (closer to zero), the more quickly the graph will advance toward zero.
Problem A10
No exponential function can reverse direction, because the ratio between successive outputs always remains constant. There is an exponential function that never increases or decreases, y = 1x. The function y = 0x is constant when x is positive, but is not defined if x is negative or zero.