


Essential Lens: Analyzing Photographs Across the Curriculum
Genetics and Bioengineering: The Societal Impacts of Mutations #2018

Metadata
Date: 2014
Location: Portland, Oregon
Photographer: Heather Young
Source: Oregon Public Broadcasting
Caption
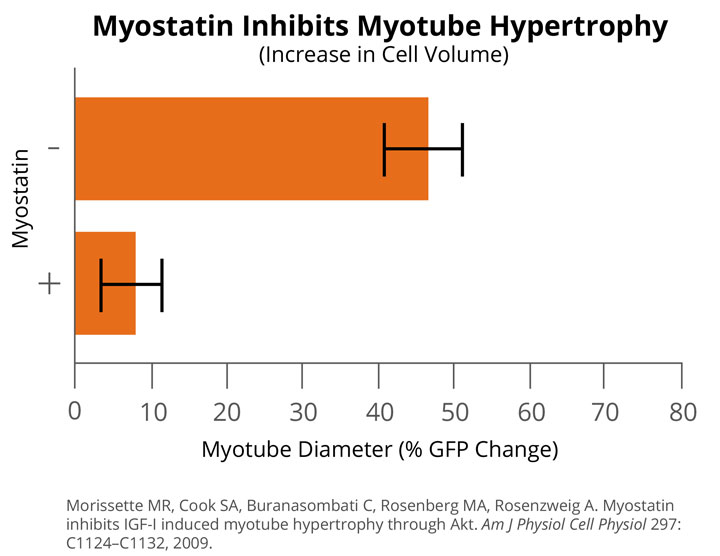
The graph above shows data that the scientists obtained from measuring at least 50 myotubes and averaging the results. In the graph, “0” was defined by measuring GFP myotubes that were not exposed to the hormone or to myostatin (photo not shown). Error bars show standard error. (Note: Students will probably draw a graph with vertical bars, which is a more standard orientation.)
Rights
Photos downloaded from the Essential Lens site are cleared for educational use only.