


Physics for the 21st Century
Dark Energy Online Textbook
Online Text by Robert Kirshner
The videos and online textbook units can be used independently. When using both, it is possible to start with either one. Watching the video first, and then reading the unit from the online textbook is recommended.
Each unit was written by a prominent physicist who describes the cutting edge advances in his or her area of research and the potential impacts of those advances on everyday life. The classical physics related to each new topic is covered briefly to help the reader better understand the research, its effects, and our current understanding of physics.
Click on “Content By Unit” (in the menu to the left) and select a unit title to view the Web version of the online text, which includes links to related material. Or, download PDF versions of the units below.
1. Introduction
We want to know what the universe is made of and how it has changed over time. Astronomers have been exploring these questions, and have discovered some surprising results. The universe is expanding, and the expansion is being accelerated by a “dark energy” that today apparently makes up more than 70 percent of the universe.

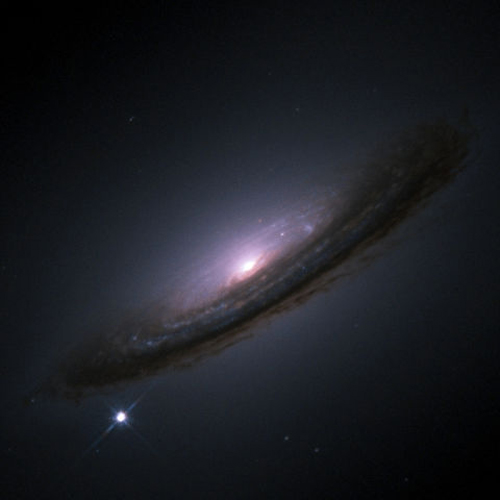
Figure 1: Type Ia supernovae, like the one shown here in the outskirts of galaxy NGC 4526, have been used to trace the influence of dark energy on the expansion of the universe.
Source: © High-Z Supernova Search Team, NASA/ESA Hubble Space Telescope.
The bright object in the lower-left quadrant of this Hubble Space Telescope image is supernova (SN) 1994D. Discovered on the outskirts of the galaxy NGC 4526 by the High-Z Supernova Search Team, this supernova was part of the data set that first indicated the existence of what we now call “dark energy.” SN 1994D is a type Ia supernova. Type Ia supernovae are special in astronomy because it is possible to determine their intrinsic brightness by monitoring how their light output changes over time. This allows astronomers to infer how far away they are. By making an independent measurement of how fast the supernovae are moving, the High-Z Team and their competitors were able to explore the relationship between distance and velocity for a large number of supernovae throughout the history of the universe. When they compiled their results, they were shocked to find that the universe appeared to be expanding at an accelerated rate, pushed apart by dark energy. (Unit: 11)
The universe that contains our planet, our star, and our galaxy, as well as 1011 other galaxies and their stars and planets, obeys the same physical laws that we have uncovered in our exploration of nature here on Earth. By applying these laws, we have learned the scale of the universe, and the surprising fact that the other galaxies appear to be moving away from us as the universe stretches out in all directions. Astronomers detected this cosmic expansion in the 1920s. They understood it by applying Einstein’s general relativity—the theory of gravity—to the universe as a whole. Recent work using exploding stars to measure the history of cosmic expansion shows that the universe is not slowing down due to the familiar braking action of gravity we know from everyday experience. The expansion of the universe has actually sped up in the last 5 billion years. In Einstein’s theory, this can happen if there is another component to the universe. We call that mysterious substance “dark energy,” and we seek to discover its properties through astronomical observations.
Today’s astronomical measurements show that dark energy makes up about 70 percent of the universe. So our ignorance is very substantial. This deep mystery lies at the heart of understanding gravity, which is no simple matter, as we saw in the first part of this course. Future observations will trace the growth of lumpy structures in the universe. These measurements can help distinguish between the effects of dark energy and possible imperfections in our understanding of gravity. We may face more surprises ahead.
This unit spells out how astronomers measure distance and velocity and describes how an expanding universe best explains these measurements. We show how recent observations of exploding stars, the glow from the Big Bang, and the clustering of galaxies make the case for dark energy as the largest, but least understood, component of the universe.
2. Before the Beginning: A Static Universe
Our understanding of the universe has changed dramatically in the last century. One hundred years ago, astronomers thought the stars of our galaxy made up the whole universe, that the galaxy was nearly motionless, and that the universe was unchanging through time. Physicists trying to think of a model for the universe had to match these “facts.”

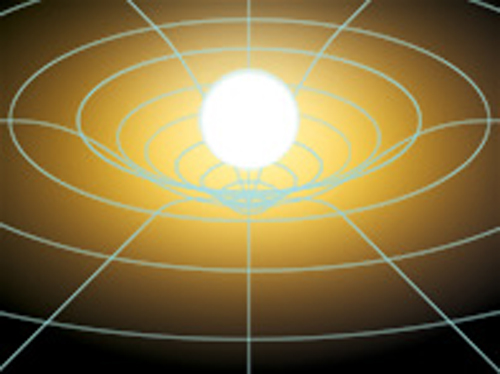
Figure 2: In Einstein’s general relativity, mass warps the fabric of space.
Source: © NASA/STScI.
In Einstein’s theory of general relativity, massive bodies warp the fabric of space around them. This affects the path light takes as it travels through space. Light travels along the shortest path from one point to another. In flat space, far from massive objects, light travels in straight lines. In the vicinity of very massive objects, however, light follows a curved path. Just as an airplane traveling from San Francisco to Tokyo follows a path that looks longer on a flat map but is actually shorter on the curved globe, the shortest path for light to take past a massive object is curved. Observations of light deflected from a straight path near the limb of the sun provided early evidence that general relativity accurately describes the physical world. (Unit: 11)
As Albert Einstein struggled to invent general relativity between 1914 and 1917, he was mindful of the possibilities for testing its predictions. Because gravity is so weak on the Earth, no laboratory measurements could test whether his ideas were right or wrong. So, Einstein looked to astronomers to help him find places to test his predictions, either because gravity was stronger (for example, near the edge of the Sun) or because the distances involved were large enough to show the cumulative effect of subtle differences from Newton’s gravity. He posed three astronomical tests for the theory: the orbit of Mercury, the path of light near the limb of the Sun, and the effect of gravity on light from dense stars—tests that general relativity eventually passed summa cum laude.
Einstein’s ideas about gravity were deeply original. He imagined that mass (and energy) would warp the fabric of space and time. Light or massive particles would then travel through this curved space. Einstein applied his equations to the universe as a whole, using the astronomical understanding of the day. In 1917, astronomers thought that our Milky Way galaxy, of which the Sun is an inconspicuous member, was, in fact, the whole universe.

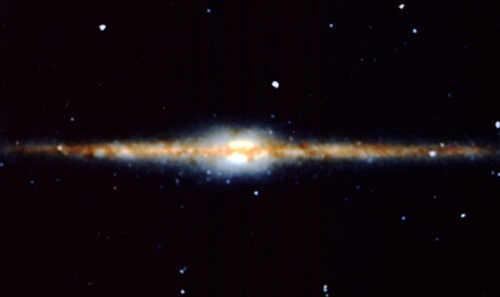
Figure 3: Edge-on view of the Milky Way.
Source: © NASA Goddard Space Flight Center.
This edge-on image of the Milky Way galaxy was taken by the COBE satellite that made the first full-sky map of the cosmic microwave background. Our solar system is located near the edge of the visible portion of the Milky Way. When Einstein was developing his theory of general relativity, there was no evidence of a universe outside the Milky Way. Unaware of the existence of other galaxies and their relative motions, Einstein added a—cosmological constant—term in his equations to ensure that the universe remained the same size throughout time. The cosmological constant prevented the matter in the universe from collapsing in on itself under the influence of gravity. Later on, after it was understood that our universe contains many galaxies that are all moving apart, Einstein removed the cosmological constant from general relativity, calling it his greatest blunder. (Unit: 11)
As far as astronomers knew at that time, the stars in the Milky Way were not moving in any systematic way. So when he wrote down an expression for the way gravity acts in the universe, Einstein added in an extra term to keep the universe static. This cosmological constant acted as a repulsive force that would balance out gravity and ensure that the universe would endure indefinitely without clumping together. Einstein found he could choose the value of the cosmological constant to produce just the right amount of curvature to make the universe “closed.” This meant it behaved like the two-dimensional surface of a sphere, which has a finite surface area and has no edge, but Einstein was thinking of four dimensions of space and time. As Einstein apologized at the time, “…we admittedly had to introduce an extension of the field equations which is not justified by our actual knowledge of gravitation…. That [cosmological constant] term is necessary only for the purpose of making possible a quasi-static distribution of matter, as required by the fact of the small velocities of the stars.”
Within a decade, astronomical observations showed that Einstein’s picture of a static universe did not match the rapidly improving observational evidence of cosmic expansion. By 1931, Einstein considered the cosmological constant an unfortunate mistake. Today, however, careful measurements of distances and velocities from exploding stars observed halfway back to the Big Bang show that we need something very much like the cosmological constant to understand why the universe is speeding up.
3. Discovery of the Expanding Universe
The surprising discovery that the universe is not static resulted from a long series of observational developments in astronomy. Establishing the distances to other galaxies and their recession from us was the work of many minds and hands. Building telescopes, making instruments to record and analyze the light they gather, deducing the properties of bright stars, applying measurements of those stars to measure distances, and heroic efforts to measure the spectra of galaxies all built the foundation for the discovery of cosmic expansion.

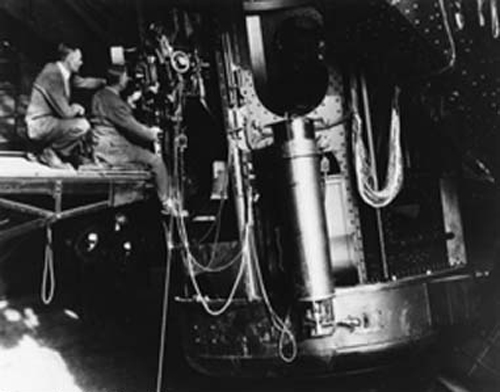
Figure 4: Edwin Hubble at the telescope.
Source: © AIP Emilio Segrè Visual Archives.
This photograph shows Edwin Hubble seated at the 100-inch Hooker telescope at Mt. Wilson Observatory. Hubble used this telescope to survey Cepheid variables in other galaxies. By taking many photographs of the stars over a long period of time, Hubble was able to measure the periodic change in brightness of these stars. He could then apply Henrietta Leavitt’s relation between period and luminosity and the inverse square law to determine the distance to the stars, finding that they were far outside our galaxy. Hubble also measured the velocities of these distant galaxies, and realized that the universe was expanding rather than static as previously thought. (Unit: 11)
While Einstein was pioneering the theory of gravity, a technological revolution was under way in astronomy. Using photographs, astronomers began to measure the size of the Milky Way and began to study the fuzzy “nebulae” mixed in among the point-like images of stars. They found it difficult to determine what these pinwheel-like objects were because they did not know whether they were nearby small systems where one star was forming or distant large objects as big as the whole Milky Way. Distance measurements in astronomy are notoriously difficult and full of subtle errors. We can judge the distances to stars from their apparent brightness, but this can be deeply deceptive. If you look up on a summer night, you might see a firefly, a high-flying airplane, the planet Mars, the bright star Deneb, and M31, the Andromeda galaxy, all with about the same apparent brightness, even though it would take 1042 fireflies to emit as much light as a galaxy. To understand the real properties of these objects, we need to know how distance affects brightness.
In general, the brightness of an object falls off as the square of the distance to the object. This is called “the inverse square law.” To use the inverse square law to determine the distance, however, you need to know how bright the object is to begin with. Stars come in an astonishing variety, from the dimmest brown dwarfs to the brightest blue supergiants. The power output, or luminosity, of stars whose distances we determine from geometry ranges over a factor of 1010. If we were foolish enough to assume they were all the same as the Sun, we would introduce huge errors into our picture of how the Milky Way is organized. We need to find a way to identify stars that have the same luminosity—some stellar property that doesn’t depend on the star’s distance from us. See The Math below.
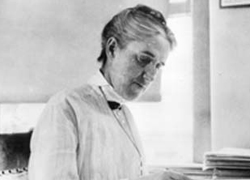
EARLY ASTRONOMICAL COMPUTERS

Henrietta Swan Leavitt © AIP Emilio Segrè Visual Archives, Physics Today Collection.
Before the emergence of the electronic version, the term “computer” referred to a person who carried out tedious, time-consuming measurements and calculations. Late in the 19th century, Edward Charles Pickering, director of the Harvard College Observatory, appointed a team of computers to measure the characteristics of stars in the observatory’s 500,000 photographic plates. The team consisted entirely of women—mainly students or graduates of nearby Radcliffe College—and became known as “Pickering’s Harem.” Pickering was concerned about getting the most work done for the minimum expense. “A great observatory,” he wrote, “should be as carefully organized and administered as a railroad.” He noted that “a great savings may be effectuated by employing unskilled, and therefore inexpensive, labor, of course under careful supervision.” However, the women who did these jobs turned out to have real talent for astronomy and published significant papers that eventually led to significant advances in many areas of astronomy, especially in understanding the physical nature of stars. The work of Henrietta Swan Leavitt on variable stars led to a revolution in understanding the scale of the universe.
A particularly helpful method came from studies of stars in the Magellanic Clouds, nearby satellites of our own Milky Way that we encountered in Unit 10. Careful studies of repeated photographic images revealed giant stars called Cepheid variable stars whose brightness increased and decreased in a rhythmic vibration repeated over a few days. Henrietta Swan Leavitt, a “computer” who studied the Cepheids, pointed out that “It is worthy of notice that… the brighter variables have the longer periods.” Cepheids are what astronomers call standard candles, objects of known luminosity. If you find a Cepheid that has the same period as one of Henrietta Swan Leavitt’s stars, no matter how bright it appears, you can assume it has the same luminosity. If you know its intrinsic luminosity and how bright it appears, you can infer its distance.

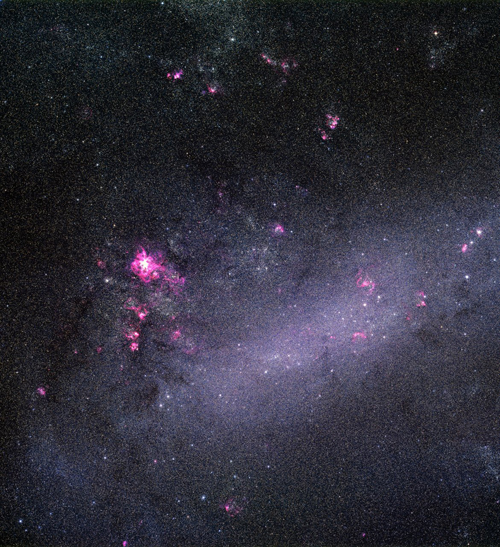
Figure 5: Large Magellanic Cloud.
Source: © ESO.
The Large Magellanic Cloud (LMC) is an irregularly shaped dwarf galaxy near the Milky Way, and one of the first galaxies outside our own to be studied by astronomers. Cepheid variable stars in the LMC were calibrated as standard candles by Henrietta Swan Leavitt, laying the essential groundwork for Hubble’s discovery of the expanding universe. (Unit: 11)
Measuring distances
Edwin Hubble, working at the Mount Wilson Observatory, home to the world’s largest telescope, conducted a campaign to find Cepheid variables in the largest nebulae, M31, M33, and NGC 6822. His goal was to determine their distances and to find out whether they were small systems in the Milky Way or distant systems as big as the Milky Way. By 1925, he had a good sample of these vibrating stars. Like Henrietta Swan Leavitt, Hubble was able to measure their periods and their brightness from photographs. For Cepheid variable stars with the same periods, hence the same luminosities, as Leavitt’s stars in the Magellanic Clouds, Hubble’s stars appeared about 225 times dimmer. Since the brightness depends on the square of the distance, that meant that his stars were about √255 = 15 times more distant than the Magellanic Clouds. This placed these “nebulae” far outside the Milky Way. Einstein had tried to model a universe of stars assembled into the Milky Way, but Hubble glimpsed a much grander system. The universe was made up of galaxies as large as the whole Milky Way, separated by distances 10 times as big as their diameters.
To measure galaxy distances, astronomers use the light-year, the distance that light travels in one year. Since the speed of light is 3 x 10⁸ meters per second and a year lasts about 3 x 10⁷ seconds, a light year is about 1016meters. A nearby star whose name we know, like Sirius, lies about eight light-years away; today, we see the light that left Sirius eight years ago, but the light from M31 takes about 2 million years to get here. So, the telescopes we use to view it act as no-nonsense time machines that allow us to record the earlier phases of cosmic evolution that occurred in the distant past. With modern equipment, we can easily detect galaxies billions of light-years away, and hence billions of years back in time.
The redshift and cosmic expansion
If Hubble had done nothing more than measure the true scale of the universe by measuring the period and brightness of Cepheids in the spiral nebulae, he would have sealed his place in the history of physics. However, he also used a different kind of measurement of the light from the nebulae to show that we live in a universe that is nothing like the static mathematical model that Einstein had constructed a few years earlier.

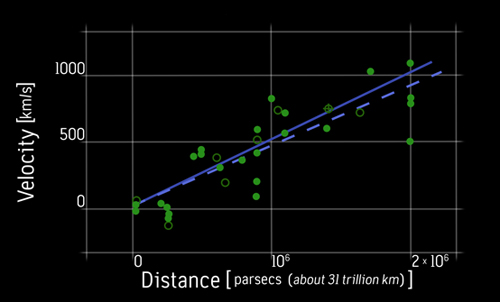
Figure 6: Hubble diagram, plotting velocity vs. distance for galaxies outside our own.
Source: Recreated from original plot by Edwin Hubble, March 15, 1929.
This diagram shows the data from Edwin Hubble’s original measurement of the velocity and distance of Cepheid variable stars in other galaxies. He measured the distance to the stars by comparing their apparent brightness to their known luminosity, and determined their velocities from the Doppler shift of their spectra. Hubble inferred from this plot that velocity is proportional to distance: galaxies that are farther away are moving away from us faster than nearby galaxies. If the universe were static, the way Einstein had originally assumed, the line through the data points on the Hubble diagram would be horizontal, and the velocity of other galaxies that Hubble observed would not depend on their distance. Instead, Hubble discovered that the universe is expanding. (Unit: 11)
In 1929, Hubble combined his distance measurements from Cepheids with those velocity measurements in the form of a graph. Today, we call this plot the Hubble diagram. While the data were crude and limited, the relation between them was unmistakable: The velocity was proportional to the distance. Nearby galaxies are moving away from us slowly (and some of the very nearest, like M31, are approaching). As you look farther away, however, you see more rapid recession. You can describe the data by writing a simple equation v = H x d, where v is the velocity, d the distance, and H, the slope of the line is called the Hubble constant. We know the equation as Hubble’s Law. See The Math below.
The Hubble diagram shows a remarkable property of the universe. It isn’t static as Einstein had assumed based on the small velocities of the stars in the Milky Way back in 1917; it is expanding. Those stars are not the markers that trace the universe; the galaxies are, and their velocities are not small. Even in this 1929 version of the Hubble diagram, the velocities for galaxies extend up to 1000 km/sec, much larger than the velocity of any star in the Milky Way.
4. Mapping the Expansion with Exploding Stars
The galaxies we see with telescopes are massive objects, and the presence of mass in the universe should slow its expansion. Starting in the 1950s, astronomers saw their task in studying cosmology as measuring the current rate of cosmic expansion (the Hubble constant), and the rate at which gravity was slowing down that expansion (the deceleration.) With that information, they would be able to measure the age of the universe and predict its future. The deceleration would show up as a small but real departure from Hubble’s Lbaw when the Hubble diagram is extended to very large distances, in the order of a few billion light-years. That’s roughly 1,000 times farther away than the galaxies Hubble studied in the 1920s. The inverse square law tells us that galaxies that are 1,000 times farther away are (1/1,000)2 times as bright. That’s a million times dimmer, and it took several decades of technical advances in telescopes, detectors, and astronomical methods to compensate for this giant quantitative difference. Today’s telescopes are 16 times bigger, our light detectors are 100 times as efficient, but we need to use much brighter stars than the Cepheids to look back far enough to see the effects of a changing rate of cosmic expansion.

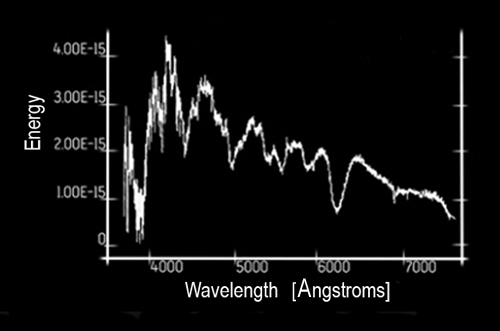
Figure 7: The spectrum of a Type Ia supernova, shown here, distinguishes it from other supernova types.
Source: Recreated from High-Z Supernova Team data, courtesy of Robert Kirshner.
Supernovae fall into several distinct classes based on the elements present in the progenitor star that absorb light during the explosion and on the overall shape of the spectrum. Type II supernovae, for example, contain hydrogen. Type I supernovae, on the other hand, contain neither hydrogen nor helium even though those are the two most abundant elements in the universe. This is one reason why we think that SN Ia arise from stars that have undergone a lengthy process of stellar evolution before they explode—as stars evolve, hydrogen fuses into helium and helium into heavier elements. The spectrum shown above is of a type Ia supernova near maximum light. The features that distinguish it uniquely as type Ia, and therefore as a standard candle useful for tracing the expansion history of the universe, are the steep rise and slow fall in intensity as the wavelength increases and the deep dip in the spectrum at 6150 Angstroms due to the presence of silicon. (Unit: 11)
Fortunately, nature has provided a brighter alternative. Some stars die a violent death in a blast of thermonuclear energy as a supernova (SN) explosion. For a few weeks, a single star shines as brightly as 4 billion stars like the sun. These thermonuclear supernovae, known as Type Ia supernovae, can be recognized from their spectra and, with some effort, used as standard candles for measuring cosmic distances.
The supernova challenge
Using Type Ia supernovae to measure cosmic acceleration or deceleration is no easy task. First, we have to find the supernovae; then we have to determine their distances and redshifts; and, finally, we have to find enough of them to make our measurement meaningful.
Although SN Ia are bright enough to see over distances of several billion light-years to detect the effects of cosmic acceleration or deceleration, they have one serious drawback: They are rare. Type Ia supernovae explosions take place about once per century in a typical galaxy. We cannot simply select the galaxies whose distances we wish to know. Instead, we have to inspect many galaxies to find the supernovae whose light has just arrived in the past week. Those are the ones we get to measure.

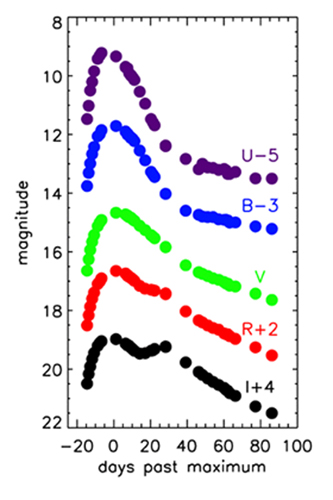
Figure 8: Light curve shape standardization.
Source: © Robert Kirshner.
The above plot shows light curves for five different supernovae. The brightness of each supernova (in the units of magnitude favored by astronomers) is plotted as a function of time. Note that the light from the brighter supernovae (purple and blue curves) decreases more slowly over time than does light from the dimmer supernovae (the black curve). This subtle difference allows astronomers to calibrate the brightness of the type Ia supernovae and use them as standard candles. (Unit: 11)
How many galaxies do we need to search? Given that SN Ia appear about once per century per galaxy, and a year has about 50 weeks, we must search 5,000 galaxies to have a good chance of finding one within a week of its maximum light. This is a good job for a “computer”—but not the human kind.
Further, SN Ias don’t possess the direct relation between brightness and vibration period exhibited by Cepheid variables. Fortunately, though, they have something similar. The light from an extra-bright SN Ia increases and decreases more slowly over time than that from a dimmer version. Careful study of the light curve can reveal which supernovae are extra bright and which are not so bright. Analyzing the light curve reduces errors in the distance to a single SN Ia to about 10 percent. This makes SN Ia plausible candidates for measuring the effect of cosmic acceleration or deceleration with a modest-sized sample, provided we look at SN Ia that are at a large enough distance that the effect of expansion, speeding up or slowing down, makes a 10 percent difference in the distance.
Finally, mathematical analysis shows that the uncertainty in the average value of something we’re trying to measure becomes smaller as the square root of the number of times we repeat the measurement. In this case, a well-measured shape for the light curve of a single Type Ia supernova gave an uncertainty in a single distance of 10 percent. The effect due to cosmic deceleration was also expected to be about 10 percent for supernovae at a distance of a few billion light-years. So, an astronomer who wanted to make the uncertainty in the mean significantly smaller than the signal that would show evidence for cosmic deceleration would need at least nine objects to push the error down to about 3 percent (10 percent/√9) and about 100 to push the uncertainty in the mean down to 1 percent (10 percent/√100). Somewhere in that range, where the ratio of the expected signal to the uncertainty in the measurement is a factor of 3 to 10, astronomers might begin to believe that they have really measured something.

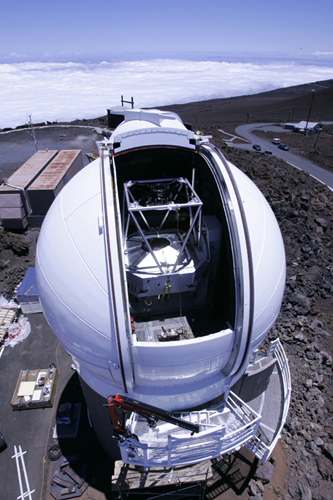
Figure 9: This Pan-STARRS telescope will find thousands of supernovae in the next decade.
Source: © Pan-STARRS, University of Hawaii.
The telescope shown here is the first of four Pan-STARRS telescopes to be built on the summit of Haleakala, a volcano on the island of Maui. The complete Pan-STARRS system will use the world’s largest digital camera—with 1.4 gigapixels—to survey the entire sky visible from Hawaii roughly once a week. This vast survey is expected to discover thousands of supernovae, greatly increasing the number of data points on the Hubble diagram and therefore increasing the precision with which we know the expansion history of the universe and its acceleration rate. (Unit: 11)
If we need to search 5,000 galaxies to find one supernova, we’ll need independent searches of 50,000 galaxies to find 10 and 500,000 galaxies to find 100. This became practical in the 1990s, when large digital cameras with tens of megapixels were mounted on 4-meter telescopes. In the coming decades, as the detector arrays grow, the hunt will reel in dozens of supernovae every night. Of course, this is still a small fraction of all the supernovae; we estimate that 30 explode somewhere in the universe every second. We have a long way to go before we will see them all.
The Astonishing Discovery of Cosmic Acceleration

Figure 9: This Pan-STARRS telescope will find thousands of supernovae in the next decade.
Source: © Pan-STARRS, University of Hawaii.
Hubble’s original diagram comparing the distances of other galaxies to their velocities showed that the universe is expanding. It was generally assumed that the expansion rate would slow over time as gravity pulled the universe back together. Scientists seeking to measure this slowing using Type Ia supernovae to probe further and deeper into the past were astonished when they added their new data points to the Hubble diagram. The top plot above is a modern version of Hubble’s original, with brightness (in astronomer’s units of relative magnitude) plotted as a function of redshift (denoted by z). The lower plot shows the difference between the data points and Hubble’s law. If the universe were expanding at a constant rate, all the points in the lower plot would lie in a straight horizontal line at zero. Instead, the supernovae with higher velocities lie above the line. This was the first evidence that the universe is expanding at an accelerated rate, driven by something we choose to call “dark energy.” (Unit: 11)
Starting in the mid-1990s, the pieces were in place for a direct approach to measuring cosmic deceleration; and by the end of the decade, two international teams were ready to publish their results. In September 1998, the High-Z Supernova Team published measurements of 16 distant and 34 nearby supernovae. To their surprise, the data pointed firmly toward acceleration. Instead of averaging a little brighter than expected for their redshift, this sample showed that the distant supernovae were about 25 percent dimmer than expected. This meant that the expansion of the universe was speeding up. Nine months later, the Supernova Cosmology Project reported on a larger sample of 42 distant supernovae. It agreed with the High-Z Team’s results. It looked as if the universe was not decelerating, but accelerating. What could cause this? One possibility was that old bugaboo of cosmological theory, the cosmological constant.
Scientists are naturally suspicious of measurements and interpretations in new areas. However, subsequent work at large and small telescopes has augmented the samples of low redshift and high redshift supernovae into the hundreds. There’s no escaping it now: The evidence from SN Ia shows that the universe is speeding up.
5. Beyond Hubble's Law
The supernovae results by themselves show that the universe is accelerating, but they don’t say exactly what is causing it. Nor, by themselves, do they tell us how much of the universe is matter and how much is the agent causing the acceleration. The supernovae measure the acceleration in cosmic expansion, which stems from the difference between the component of the universe that makes things speed up (Ω∧) and the component that makes them slow down (ΩM). Apparently, Ω∧ now has the upper hand in the cosmic tug-of-war, but we’d like to know how much of the universe is in each form. We can obtain a much more complete idea of the contents of the universe by including other strands of evidence.
To determine the cosmology of the universe we live in, the two most effective pieces of information are the geometry of the universe, which tells us about the sum of the amount of matter and the cosmological constant (or whatever it truly is) driving the acceleration, and direct measurements of the amount of matter. In Unit 10, we learned that the cosmic microwave background (CMB) gives us direct information on the total amount of matter in the universe. It turns out that the CMB also gives us an excellent measurement of the geometry.
Density, geometry, and the fate of the universe
Einstein’s theory of general relativity describes the connection between the density of the universe and its geometry. A particular value of the cosmic density, called the critical density, corresponds to flat space—the geometry of Euclid that is taught in schools. For cosmic expansion, this term depends on the current rate of expansion—the Hubble constant. More precisely, the critical density is given by ρcrit = 8πH0/3G, where G is the gravitational constant that we first met in Unit 3.
The arithmetic shows that, for a Hubble constant of 70 km/sec/Mpc, ρcrit = 9×10-27kg/m3 . This is a significantly small number compared with the emptiest spaces we can contrive in a laboratory on Earth. It corresponds to about five hydrogen atoms in a cubic meter. Modern evidence, especially from the analysis of the cosmic microwave background that we encountered in Unit 10, shows that our universe has the geometry of flat space, but the sum of all the forms of gravitational matter is too small to supply the needed density.

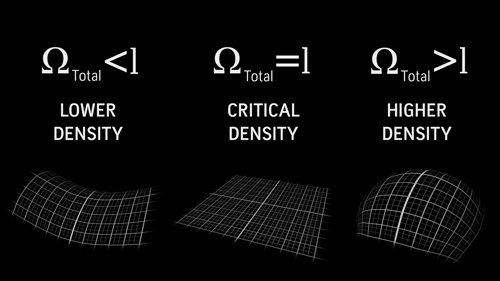
Figure 12: The geometry of the universe depends on its density.
The geometry of the universe—which dictates whether the universe will expand forever or collapse back into a single point—depends on the density of the universe. Astronomers usually compare any density they are measuring to the critical density, which corresponds to the flat Euclidean space familiar from high school geometry class. If the density of the universe, denoted by omega, is equal to the critical density (omega = 1), space is flat and the universe will expand slower and slower throughout time. If the density is higher than the critical density (omega > 1), space will be positively curved like the surface of a sphere, and the universe will eventually collapse in on itself. If the density is lower than the critical density (omega < 1), space will be negatively curved like the surface of a saddle. Evidence from the cosmic microwave background shows that our universe has the geometry of flat space. (Unit: 11)
Astronomers usually compare any density  they are measuring to the critical density ρcrit. We call this ratio omega (Ω) after the last letter in the Greek alphabet. (We should use the last letter to describe something that tells us how the world will end.) So Ω=ρ/ρcrit —a pure number with no units. The total density of the universe is simply the sum of the densities of all its constituents, so Ωtotal is equal to the matter density ΩM that we discussed in unit 10 plus the density of anything else out there, including the energy density associated with the cosmological constant, Ω∧. A value of Ωtotal less than one means that the universe has an “open” geometry, and space is negatively curved like the surface of a saddle. If Ωtotal is greater than one, the universe has a “closed” geometry, and space is positively curved like the surface of a sphere. And if Ωtotal equals one, the geometry of the universe is that of flat space.
Modern evidence, especially from the analysis of the cosmic microwave background, shows that our universe has the geometry of flat space, but the sum of all the forms of gravitating matter is too small to supply the needed density. The energy density associated with the cosmological constant, we believe, makes up the difference.
The anisotropic glow of the cosmic microwave background
The measurement of cosmic geometry comes from observations of the glow of the Big Bang, the cosmic microwave background (CMB). As we saw in Unit 10, Bell Labs scientists Arno Penzias and Robert Wilson observed this cosmic glow to be nearly the same brightness in all directions (isotropic), with a temperature that we now measure to be 2.7 Kelvin.
Although the CMB is isotropic on large scales, theory predicts that it should have some subtle texture from point to point, like the skin of an orange rather than a plum. The size of those patches would correspond to the size of the universe at a redshift of 1,000 when the universe turned transparent, and the radiant glow we see today was released. We know the distance to these patches, and we know their size: The angle they cover depends on how the universe is curved. By measuring the angular scale of this roughness in the CMB, we can infer the geometry of the universe.

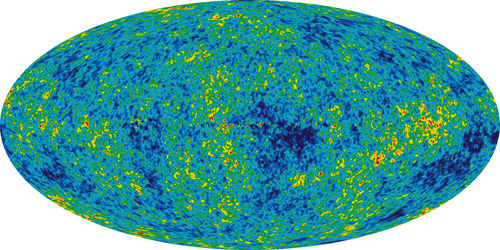
Figure 13: The cosmic microwave background, shown here, has subtle texture from point to point.
Source: © NASA, WMAP Science Team.
This map shows the pattern of temperature variations in the cosmic microwave background (CMB) measured with the WMAP satellite. WMAP made a differential measurement of the CMB temperature with two sensitive radio antennae mounted with a fixed displacement between them. As the satellite rotated, the radio antennae traced out temperature variations in the entire sky. The largest temperature differences (between red and dark blue regions) are about 0.0004 K, and the characteristic angular size of the temperature variations is around 1 degree. The 1-degree scale of the temperature variations tells scientists that the geometry of the universe is flat, so Ω = 1, and the overall pattern reveals that ΩM is 0.27. If Ω= ΩM + Ω∧, then ,Ω∧= 0.73 and dark energy makes up the bulk of the universe. (Unit: 11)
The technical difficulty of this measurement is impressive: The variations in temperature that we must measure correspond to about 0.001 percent of the signal. However, in 2000, astrophysicists measured the angular scale well from Earth and better from the WMAP satellite three years later. The angular scale is just about 1 degree, which corresponds with amazing precision to the angle we would measure if the geometry of the universe as a whole were Euclidean. To an uncertainty of just a few percent, the universe is flat, and ΩM + Ω∧ is 1.
The results from Unit 10 are consistent with ΩM of about 1/3. If the total of ΩM and Ω∧ and Ω∧ is 1, as the angular scale of the temperature fluctuations in the CMB strongly suggest, this suggests that 2/3 of the energy density in the universe is made up of Ω∧. Not only is there something driving cosmic acceleration, as the supernovae show, but the CMB observations also require a lot of it.
Summing up

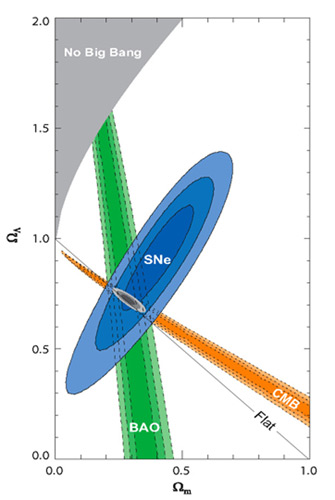
Figure 14: Combining evidence from supernova and the CMB makes a strong case for dark energy.
Source: © Supernova Cosmology Project, Lawrence Berkeley National Laboratory.
The two primary lines of evidence for dark energy are the accelerated expansion of the universe measured by supernova surveys and the discrepancy between the geometry and amount of matter in the universe measured by the CMB. The plot above, with on the vertical axis and on the horizontal axis, compares the results of these two measurements. The broad orange line shows values of and that are consistent with the geometry and amount of matter allowed by the CMB measurement. The blue ellipses show values consistent with the supernova measurement, with the darker shades of blue corresponding to more likely values. The green line shows the result of another set of measurements of galaxy clusters. All three measurements are consistent—the orange, blue, and green parts of the graph meet in a single point. The gray ellipses show the values of and most consistent with all of the measurements, which we take as a sign that the picture we are developing for a universe filled with dark energy is a reliable one. (Unit: 11)
The CMB gives us a way to measure the geometry of the universe, which tells us about the sum ΩM and Ω∧, the CMB as well as measurements of galaxy clustering tell us about ΩM, and the supernova results tell us about Ω∧ independently. We can compare the components best in a graph that plots the value of ΩM on one axis and Ω∧ on the other. The supernova results (shown in blue) are broadly consistent with a line that looks like a constant value of ΩM – Ω∧. The CMB results (shown in orange) are approximately what we would get for a constant value (of 1) for the sum of these two components of the universe. On the plot, these represent two lines that are very nearly perpendicular. They cross at a value of about 1/3 for ΩM and 2/3 for Ω∧. Of course, they have to cross somewhere. So how do we know how much to trust this result?
A separate line of evidence employs data on the way that the action of gravity clusters galaxies and the imprint of the very subtle early density fluctuations on today’s pattern of galaxy locations. Both depend chiefly on the value of ΩM, and they give another constraint in the diagram (shown in green), as a nearly vertical line at ΩM equaling about 0.3. While two lines in a plane have to cross, there’s no guarantee that three lines will cross in the same place, but they do. We take this as a sign that the picture we are developing for the universe is a reliable one and that a mixed dark matter and dark energy universe with 1/3 dark matter and 2/3 dark energy is about right.
6. The Concept of Dark Energy
It’s a good thing that we have such confidence in the concordance of the measurements described in this unit, because the overall picture they indicate is completely astonishing. If we take the measurements seriously—and we should—they point to a universe dominated by something that acts to make the universe speed up, partially balanced by matter that makes galaxies clump together. However, two large and deep mysteries surround this view.

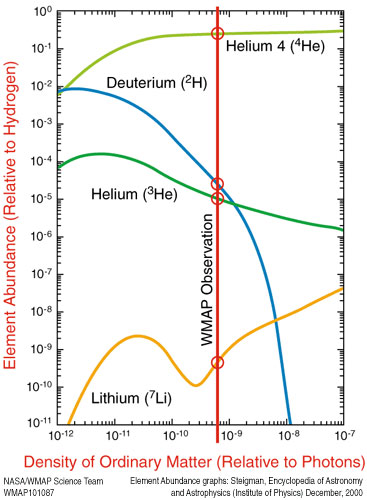
Figure 15: The abundance of light elements indicates that most of the universe is not protons, neutrons, or electrons.
Source: © NASA, WMAP Science Team.
The figure above shows how the abundance of the light elements deuterium, helium, and lithium, would change if the amount of ordinary matter in the universe were different. The red line shows the value for the density of ordinary matter we believe to be correct (see Unit 10), and the red circles show the expected abundance of the different elements we should observe. Experimental values are in excellent agreement with this prediction, falling within the red circles on the plot. This agreement supports the notion that the density of ordinary matter is only 4 percent of the critical density. The remainder is made up of dark matter and dark energy. (Unit: 11)
One is that most of the matter in the universe cannot take the form that makes up galaxies, stars, and people: the familiar elements of the periodic table and their subatomic constituents of protons, neutrons, and electrons. Based on our understanding of the way light elements such as helium would form in the hot Big Bang, we know that this nuclear cooking can agree with the data only if most of the universe consists of something that is not protons, neutrons, or electrons. We call this dark matter, but, as we saw in Unit 10, we don’t know what it is.
The other mystery stems from the fact that the cosmological constant is not the only candidate for the component of the universe that makes expansion speed up. If we try to estimate the energy density of the cosmological constant from basic quantum mechanical principles, we get a terrible quantitative disagreement with the observations. The computed number is at least 1060 times too large. Before the discovery of cosmic acceleration, physicists took this disagreement to mean that somehow nature covers up for our ignorance, and the real value is zero, but now we know that can’t be right.
A dense web of evidence tells us that the energy associated with gravity acting in empty space is not exactly zero, but it isn’t the gigantic value computed from theory, either. Clearly, something is missing. That something is a deeper understanding of how to bridge the two great pillars of modern physics: quantum mechanics and general relativity. If we had a good physical theory for that combination, presumably the value of the cosmological constant would be something we could predict. Whether that hope is valid or vain remains to be seen. In the meantime, we need a language for talking about the agent that causes cosmic acceleration.
Dark energy, dark matter, and the cosmological constant
To cover the possibility that the thing that causes the acceleration is not the cosmological constant, we use a more general term and call it dark energy. For example, dark energy might change over time, whereas the cosmological constant would not. To express our combination of confidence that dark energy is real and our ignorance of its precise properties, we describe those properties by talking about dark energy’s equation of state—the relation between the pressure of a gas and its density.
The cosmological constant doesn’t act like any gas we have ever used to squirt paint from an aerosol can. We’re used to pressure going down as the gas expands. If dark energy is really a constant energy density, as it would be if it were identical to the cosmological constant, then the vacuum energy in each cubic meter would remain the same as the universe expands. But if dark energy behaves slightly differently from the cosmological constant, that energy density could go up or down; this would have important, and possibly observable, consequences for the history of cosmic expansion.
Taking our best estimates for the fraction of the gravitating matter that is dark matter and the fraction associated with the glowing matter we see, and assigning the convergence value to dark energy yields the amazing pie chart diagram for the universe that we encountered in Unit 10. To our credit, the diagram is full. However, it is full of ignorance: We don’t know what dark matter is, and we don’t know what dark energy is. In science, this is not such a bad situation to be in. It leaves plenty of room for future discovery.

Diverse lines of evidence lead us to believe that less than 5 percent of the universe is composed of the familiar particles of the Standard Model, and only 27 percent of the universe is composed of matter. The remainder is dark energy, which is the name we give to whatever is causing the expansion rate of the universe to accelerate, and also to whatever accounts for the discrepancy between the amount of matter in the universe and its geometry. Dark energy is one of the most important and intriguing phenomena in physics today. Is it Einstein’s cosmological constant? Are we misunderstanding how gravity works on large scales? We can use quantum mechanics to calculate how much energy empty space should have—why is this number so wildly different from what we observe? Our ignorance leaves a great deal of room for future discovery. (Unit: 11)
We have some ideas of how to proceed in learning more about the nature of both dark matter and dark energy. As we saw in Unit 10, physicists have embarked on several efforts to determine the identity of dark matter, using beams in accelerators, detectors in underground laboratories, and instruments in space. All of this is quite speculative, but very exciting. We could well be on the threshold of making a crucial measurement about dark matter.
Our expectations for learning more about dark energy are more modest. Larger, more sophisticated, and more certain surveys of supernovae, galaxy clustering, and other tracers of the way the universe has changed over time provide the most promising path forward.
7. From Deceleration to Acceleration
We have learned that the universe—far from being small and static as was thought in Einstein’s day—is large and dynamic. At present, it is expanding at an ever-faster rate. As it does so, the relative amounts of matter and dark energy change. If this version of cosmology is correct, we can use it to reconstruct the past and predict the future. Whenever possible, we test these predictions against observation.

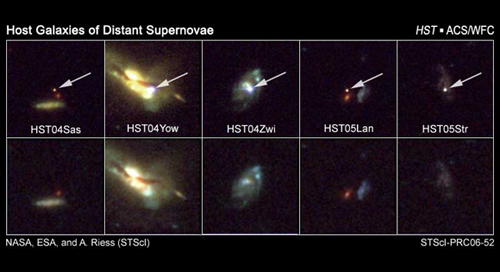
The Hubble Space Telescope, able to collect images free from the limitations imposed by looking through the Earth’s atmosphere, has been a critical tool in the discovery of the highest redshift SNae Ia ever observed. The top row of images shows several of these supernovae near maximum light, while the bottom row of images shows the host galaxies without the supernovae. This sample of supernovae falls on the right-hand side of the Hubble diagram, the region of the plot in which the evidence for dark energy is most obvious. Adding these, together with 16 other HST-detected SNae Ia, to the existing Hubble diagram in 2007 cut in half the uncertainty in our knowledge of the Hubble parameter, and strengthened the case for dark energy. (Unit: 11)
SN Ia provide a proven method for tracing the history of cosmic expansion. One direction that has proven fruitful has been to press the search for supernovae to fainter fluxes and hence larger distances. That allows us to probe the accumulated effect of cosmic expansion over ever-longer stretches of time. The initial measurements from 1998 had their strongest information at distances that correspond to about 5 billion light-years. But it is possible, with great effort, to push these measurements to earlier epochs. Astrophysicists have done this most effectively using the Hubble Space Telescope (HST), which is no larger than the telescope Hubble himself used at Mount Wilson, but observes from a much better site, above the blurring caused by the Earth’s atmosphere.
Looking back at the past
HUBBLE IN—AND OUT OF—TROUBLE

Hubble spacecraft. © NASA/STScI.
When NASA launched the Hubble Space Telescope into an orbit about 600 kilometers above Earth in April 1990, astronomers anticipated a cornucopia of new observations. But, within a few weeks, a serious problem emerged: The telescope’s primary mirror had been precisely figured, but to the wrong shape. Fortunately, STScI engineer Jim Crocker devised a clever correction inspired by the folding spray head of the shower at the Hoyacker Hof in Garching. His plan involved adding two small new mirrors that unfolded into the light path and corrected for the telescope’s main mirror. In December 1993, a team of astronauts aboard the space shuttle installed the “corrective optics space telescope axial replacement” package. The fix worked perfectly as a stopgap, and all the instruments brought up to HST since then have had their own corrections built in.
A decade after the successful repair, the HST faced another crisis. Sean O’Keefe, NASA’s administrator at the time, canceled the final servicing mission to the telescope, scheduled for early 2005, asserting that the mission involved too much risk for the astronauts. However, astronomers were not willing to abandon one of NASA’s most productive scientific satellites without a fight. They mounted a campaign that persuaded O’Keefe’s successor, Michael Griffin, to reschedule the mission. Carried out in May 2009, it left the Hubble in good health. Astronomers hope that HST will be pouring out valuable data on cosmic questions for many years to come.
If the universe consists of a combination of dark energy and dark matter, adding up to a Ωtotal of 1, the equations of cosmic expansion guarantee that at earlier times (and later) the Ωtotal will remain 1. But the balance of dark energy and dark matter is expected to change with cosmic epoch. As we look into the past, we see that the density of dark matter must have been higher than it is now. After all, every cubic meter of the universe we see today has stretched out from a smaller region. Compared to redshift 1, the length of any piece of the universe has doubled; so the volume of space that occupies one cubic meter today took up only 1/2 x 1/2 x 1/2, or 1/8, of a cubic meter back then. If you had the same matter in that volume at redshift 1 as we do today, then the density would have been higher in the past, by a factor of 8.
How this affects cosmic acceleration depends on the difference between dark matter and dark energy. If dark energy is identical to the cosmological constant, it lives up to its name by having a constant value of energy density. In that case, we expect that, when we look back to redshift 1, we would find dark matter to be eight times more important than it is today, while dark energy would show no change. This means that dark matter, the gravitating material, would have had the upper hand, and the universe should have been decelerating.
This is not just a matter for speculation. Using the HST, we can find and measure supernovae at this epoch, halfway back to the Big Bang. Measurements of 23 supernovae with large redshifts discovered and measured with HST were reported in 2004 and 2007 by Adam Riess and his colleagues. The data show that we live in a universe that was slowing down about 7 billion years ago. The balance shifted somewhere around 5 billion years ago, and we now live in an era of acceleration. In more detail, the data now in hand from 400 supernovae near and far allow us to trace the history of cosmic expansion with some precision. A dark energy that acts like the cosmological constant would be adequate to fit all the facts we have today. That doesn’t mean this is the final answer, but a better sample will be needed to find out if the universe has a more complicated form of dark energy.
The prospect of a lonely future
A telescope lets us collect light emitted in the distant past. Looking into the future is more difficult, since we have only human minds as our tools, and our present understanding of dark energy is incomplete. But if dark energy acts just like the cosmological constant, the future of cosmic expansion is quite dramatic.
A constant dark energy produces exponential expansion. The larger the universe becomes, the faster it will expand. The expansion can become so fast that light from distant galaxies will never reach us. Even galaxies we see now will be redshifted right out of our view; so as the universe ages, an observer at our location will see fewer galaxies than we can see today.

Figure 18: Hubble Space Telescope panoramic view of thousands of galaxies in various stages of evolution.
Source: © NASA, ESA, R. Windhorst, S. Cohen, M. Mechtley, and M. Rutkowski (ASU, Tempe), R. O’Connell (UVA), P. McCarthy (Carnegie Observatories), N. Hathi (UC, Riverside), R. Ryan (UC, Davis), H. Yan (OSU), and A. Koekemoer (STScI).
This image, taken with the Wide Field Camera (WFC3) on the Hubble Space Telescope, shows thousands of galaxies in various stages of evolution. The galaxies we see here span more than 12 billion years of cosmic history. If our present understanding of dark energy is correct, the larger the universe becomes, the faster it will expand. The galaxies we see now will be redshifted out of view in the very distant future, leaving each galaxy isolated from all the rest. (Unit: 11)
If we follow the logic (and assume that our present understanding is perfect), eventually our Milky Way Galaxy and nearby Andromeda will be separated from this outwardly accelerating scene, and Andromeda and our other local neighbors will be the only galaxies we can see. Worse, we will eventually collide with Andromeda, leaving just one big galaxy in an otherwise empty universe. In a strange way, if this prophecy for the long-term future of our galaxy comes true, it will produce a situation much like the picture of the Milky Way as the entire universe that prevailed in Einstein’s time.
8. Dark Energy Theory

The ball in this electron microscope image, only a tenth of a millimeter in diameter, is positioned to measure the quantum mechanical effects of empty space. When a smooth plate is placed above the ball, the ball is drawn toward it in response to a force generated by the quantum mechanical effects of the empty space between the plate and the ball. The tiny displacement in the ball’s position, measurable with an atomic force microscope, is evidence that the quantum mechanical view of empty space as a seething froth of particles and antiparticles is correct. (Unit: 11)
The advent of cosmic acceleration about 5 billion years ago looks just like the change in the expansion rate that the cosmological constant would produce. Does this prove that dark energy is a modern version of the cosmological constant? Not exactly. The modern view of the cosmological constant is that the vacuum—empty space itself—has some properties that we can understand only by using quantum mechanical ideas. In the case of electromagnetism, for example, the quantum picture views the vacuum not as an inert background on which the electrical and magnetic forces act, but on the submicroscopic scale, as a seething froth of particles and their antiparticles that are being created and annihilated all the time.
One way to think of this busy scene on very small scales involves the Heisenberg uncertainty principle that we encountered in Units 2 and 5. This tells us that the better we know the location, the more uncertain is our knowledge of the energy at that place. If we insist on looking on very fine spatial scales (much smaller than an atom), the energy could be large enough to create a particle and its antiparticle. These particles would find each other soon enough and annihilate. If we look on a big scale, the average value of their density would be zero, but on a very small the fluctuations about zero would be quite large.
For electromagnetism, this picture of the vacuum makes a subtle difference to the forces we predict between charged particles. Physicists can test these predictions in high-precision laboratory experiments. The measurements agree better with this picture than with one in which the vacuum is a featureless mathematical space for electric and magnetic fields. So, this seems like the right way to proceed for other forces.
An appalling disagreement on vacuum energy
If we do the same kind of analysis of the vacuum for the gravitational force, we find that, because of that force’s extreme weakness, the appropriate length scale is much smaller than for electromagnetism and the resulting energy fluctuations are much larger. In units where the observed value of the cosmological constant is 0.7, the calculated value for the vacuum energy associated with gravity is not 1 (which would be close enough) or 10, 100 (102), 1000 (103), or even 104. It’s at least 1060.
This is not just a small numerical puzzle: It is the worst quantitative disagreement in all of physical science. For decades, physicists have swept this strange result under the rug. But now that we have a real astronomical measurement of the effects of vacuum energy, it seems to demand an explanation. Why is the energy of the vacuum so small?
Figure 20: In Einstein’s general relativity, mass warps the fabric of space.
Source: © NASA/STScI.
The honest answer is that we don’t know. That’s why the discovery of cosmic acceleration points directly to a problem at the heart of physics: What, exactly, is gravity? Or, more specifically, what is the right way to incorporate quantum ideas into the theory of gravity? Einstein’s gravity is not a quantum theory. It is one in which a featureless mathematical space is warped by the presence of mass and energy and through which massive particles and photons travel. The appalling discrepancy between the predictions of theory and the astronomical observations has led to some novel ideas that seem a bit odd.
The anthropic principle: We’re here because we’re here
One novel idea posits many possible universes that make up a more varied “multiverse” of more or less unrelated regions. Each universe might have its own set of physical constants that governs such factors as the energy of the vacuum. If we happen to be in a region of the multiverse where that value is big, the acceleration sets in immediately, gravity never gets a chance to pull matter together, galaxies never form, stars never form, and interesting chemical elements like carbon are never produced. This boring universe contains no life and nobody to say proudly that “the energy of the vacuum is just as we predicted”. Even though it could be that this large value for vacuum energy is the norm and our patch of the multiverse has an extremely low and unlikely value for the vacuum energy, we can’t be completely surprised that a place also exists in which galaxies did form, stars did form, carbon was produced, and the living things on a planet would scratch their heads and ask, “Why is our vacuum energy so low?” If it hadn’t been, they—or, more accurately, we—wouldn’t be there to ask.
This “anthropic” idea—that the presence of humans tells us something about the properties of the universe in which we live—is quite controversial. Some people regard it as unscientific. They say that our job is to figure out why the universe is the way it is, and that invoking this vague notion is giving up too easily on the quest for understanding. Others think it trivial: Of course we’re here, they say, but that doesn’t help much in discovering how the world works. Still others are convinced that we don’t have any better explanation. For them, a multiverse with many chances for unlikely events to happen, combined with the anthropic principle that selects our unlikely universe, seems the best way to make sense of this very confusing topic.
9. Further Studies of Dark Energy
The problems posed by dark energy are fundamental and quite serious. While the observational programs to improve our measurements are clearly worth pursuing, we can’t be sure that they will lead to a deeper understanding. We may need a better idea about gravity even more than precise determinations of cosmic expansion’s history, and it seems likely that a truly new idea will seem outrageous at first. Unfortunately, the fact that an idea is outrageous does not necessarily mean that it is a good one. Separating the wild speculations from the useful new ideas is a tricky task, but better observations will help us to weed out some of the impossible ideas and let us see which of the remaining ones best fit the data.

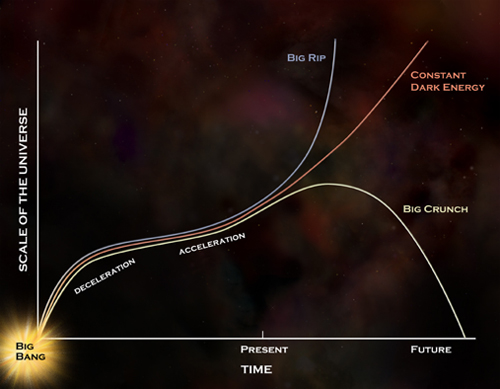
Figure 21: The future scale of the universe depends on the nature of dark energy. Source: © NASA, CXC, M. Weiss.
So far, our measurements of the cosmic equation of state are consistent with dark energy that behaves just like the cosmological constant. However, more precise measurements could reveal some variation and a different fate for our universe. The figure above shows various possibilities. If the dark energy is constant, the scale of the universe will continue to grow along the path defined by the red line. We now know that we are not headed for either the big rip or big crunch indicated by the blue and green lines, respectively, and that our fate lies between those two lines. While there is a lot of space between those lines in the future, at the present time they are close together. Detecting any deviation from a cosmological constant will require precision measurements. Any deviation from a constant would be very interesting. (Unit: 11)
One way to approach dark energy is to try to pin down its equation of state. So far, our measurements of the cosmic equation of state are completely consistent with the cosmological constant, but perhaps some variation will show up when we do more precise measurements. Any deviation from a constant energy density would show that the cosmological constant idea was not right, and that we require something more complicated to match the facts for our universe.
Another way to think about cosmic acceleration is to ask whether it is telling us something new about general relativity. After all, though Einstein’s theory is a beautiful one and has passed every experimental test to which it has been subjected, it dates back to 1917. Possibly there is some aspect of gravity that he did not get exactly right or that would show up only on cosmic length scales. So far, we have no evidence that Einstein’s geometrical theory needs amendment, but physicists are always alert for possible cracks in the foundation of our understanding. They want to use astrophysical measurements to test whether general relativity needs to be modified.
Identifying galaxy clusters
To date, the predictions that best test whether general relativity is the right theory of gravity to account for an accelerating universe are those that predict how matter will clump and structure will grow in an expanding universe. By comparing clusters of galaxies, which are the largest aggregations of matter we know of, at large and small distances, astronomers have been able to put some useful limits on this aspect of gravity. Again, everything so far agrees with general relativity: Only more precise measurements could detect a small deviation from that picture.
For more precise measurements, we need better samples of galaxy clusters. Finding such clusters in optical images is tricky because some of the galaxies are in the foreground and others are in the background, making the more distant clusters more and more difficult to distinguish. Since the whole measurement depends on comparing the numbers of distant and nearby clusters, this is a dangerous sort of bias.

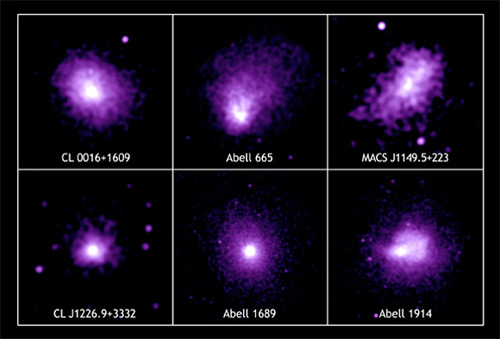
Figure 22: X-ray images of galaxy clusters observed with the Chandra X-Ray Observatory. Source: © NASA, CXC, MSFC, M. Bonamente et al.
The six galaxy clusters shown here were observed with the Chandra X-ray Observatory. It is tricky to detect galaxy clusters in visible-light images because galaxies in the cluster are difficult to distinguish from galaxies in front of and behind the cluster. It is much easier to detect galaxy clusters in x-ray images because there is very hot gas between the galaxies of a cluster that emits x-rays. Chandra’s complete set of galaxy cluster observations show that dark energy stifled the growth of these massive structures over the past seven billion years. (Unit: 11)
A better way to find galaxy clusters relies on their emission of x-rays. The gravitational well formed by 1014 solar masses of (mostly dark) matter in a galaxy cluster means that the gas (mostly hydrogen) that falls into the cluster or that is exhaled from the galaxies can gain a lot of energy in the process. It must be very hot to have enough pressure to keep from collapsing to the center of the cluster. The temperature for the gas in clusters is about 107K, and the emission from such a hot ionized gas occurs principally in the x-ray part of the spectrum.
X-ray telescopes can search the sky for large sources of x-ray emission, and in some cases we can identify the sources with galaxy clusters. However, the inverse square law applies to x-rays just as it does to optical light. So, the more distant clusters are fainter, and the sample becomes more incomplete and harder to interpret as you observe fainter clusters. Although our best data so far comes from the x-ray selected samples, astronomers have a better technique.
Seeking patterns in the CMB
The signature of hot gas in a cluster of galaxies includes more than emitted x-rays. The fast-moving electrons in the gas can sometimes collide with photons from the cosmic microwave background. These collisions kick up the low-energy radio photons to higher energies. The interactions show up as distinct patterns in the CMB in the neighborhood of a cluster.
The map of the CMB usually shows only slight temperature variations from point to point, but the lack of low-energy photons reveals itself as a large cold spot in the map. If you tune your radio receiver to a slightly higher energy, you’ll see a bright area that contains the extra photons kicked up to higher energy by the collision with the fast electrons in the cluster. In 1969, Physicist Yakov Zel’dovich and his student Rashid Sunyaev, now a distinguished astrophysicist, worked out the theory of this pattern. It is only recently that the Sunyaev-Zel’dovich Effect has become a practical way to find clusters of galaxies.

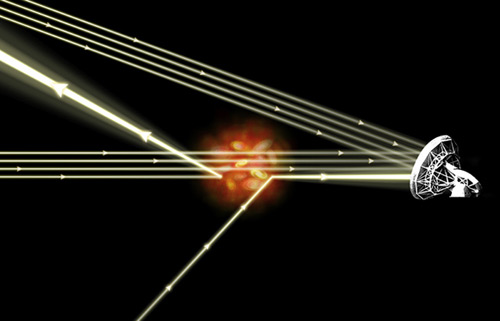
Figure 23: The Sunyaev-Zel’dovich effect allows astronomers to find the signature of galaxy clusters in the CMB.
Source: © NASA, CXC, M. Weiss.
When cosmic microwave photons pass through a galaxy cluster, about 1 percent of them scatter off of hot electrons in the gas filling the space between galaxies in the cluster. This is called the “Sunyaev-Zel’dovich effect.” When the photons scatter, they gain energy from the electrons. Thus, galaxy clusters appear in a map of the CMB as cold spots at the original photon frequency, and hot spots at a higher frequency. Microwave telescopes such as the South Pole Telescope can detect galaxy clusters using the Sunyaev-Zel’dovich effect, while x-ray telescopes such as Chandra can map the hot gas that scattered the CMB photons. These measurements together allow astronomers to measure the growth of structure in the universe. (Unit: 11)
Using the South Pole Telescope, which observes the CMB from Antarctica, astronomers have started to prepare a new, large, and uniform catalog of clusters. One surprising feature of the Sunyaev-Zel’dovich measurements is that the distinctive signature of a cluster does not depend on its distance. So, this method should work just as well at finding distant clusters as at finding nearby ones. This seems likely to be the best way to measure the growth of structure in the universe in the years ahead, and to test whether Einstein’s theory of gravity is enough to account for all the facts in our accelerating universe.
Future searches for dark energy
Future measurements will include better samples of supernovae to measure the expansion history of the universe, but astronomers are also developing new ways of monitoring the properties of the universe. These include looking directly at the clustering of galaxies and, less directly, at the gravitational lensing that clumped matter produces.
As shown in Units 3 and 10, mass in the universe curves space. This means that the mass associated with galaxies can act like lenses that distort and magnify the scene behind them. We see this effect in galaxy clusters, which form long, thin arcs of light by bending the light from galaxies behind them. Weaker lenses can distort the shape of background galaxies. By carefully measuring how images of galaxies are warped at low and high redshifts, we can construct another picture of the way in which mass has grown more concentrated over time. This will give us a further clue to whether the growth of structure in the universe we live in matches or contradicts the predictions of general relativity.

Figure 24: The Joint Dark Energy Mission will make precise measurements of the effects of dark energy from space. Source: © NASA, GSFC.
The Joint Dark Energy Mission, or JDEM, is a joint effort by NASA and the Department of Energy to make better observations of the universe that will enhance our understanding of dark energy. Scheduled to launch in 2016, the JDEM Dark Energy Space Telescope will be equipped with a powerful instrument suite capable of wide-field imaging and spectroscopy in both the visible wavelength range and the infrared. The telescope will be used to survey type Ia supernovae, weak gravitational lensing, and the clustering of galaxies. These three measurements, taken together, can provide the key to distinguishing between different models of dark energy. (Unit: 11)
Measuring the properties of the universe is the only path we have for learning the properties of dark energy and testing whether Einstein’s gravity theory gives us the whole story for assembling galaxies and clusters out of a very subtly rippled past. What’s missing is an experimental test on the laboratory scale, or even the solar system scale, that would show us the presence and properties of dark energy. Unlike the case of dark matter, where it seems that we have the technology to detect the phenomenon and are on the brink of doing so, nobody has a clue about how to make a laboratory experiment to detect dark energy. Just as Einstein had to rely on astronomy to test his theory of general relativity, our only “laboratory” for measuring dark energy seems to be the universe itself.
10. The Math
Inverse Square Law
The inverse square law describes how the brightness of an object appears to decrease with distance. The intensity, I, of light on the surface of a sphere of radius, r, with a point source of light at its center is:
I = L/4πr2
where L is the total power output (luminosity) of the light source. According to the inverse square law, the amount of light from a star or a supernova collected by a telescope decreases as the square of the telescope’s distance from the object. Thus, an object twice as far away will appear four times less bright. This relation between brightness and distance allows astronomers to determine the distance to standard candles by measuring their brightness.
Hubble’s law states that the velocity, v, of a distant object such as a galaxy is proportional to its distance, d:
v = Hd
The proportionality constant, H, is called the Hubble constant. Hubble’s Law was formulated to describe the measurements of galaxies Edwin Hubble made in the 1920s. These measurements were revolutionary because they provided concrete evidence that the universe is expanding, rather than static. Today we understand Hubble’s Law as the result of the stretching of light as the universe expands rather than the motion of individual galaxies. This cosmological redshift can be expressed in the usual velocity units of kilometers per second, but its origin is in the overall expansion of the universe.
11. Further Reading
- Timothy Clifton and Pedro Ferreira, “Does Dark Energy Really Exist?” Scientific American, April 2009, p. 48.
- Robert Kirshner, “The Extravagant Universe,” Princeton University Press, 2004.
- Michael Lemonick, “Echoes of the Big Bang,” Princeton University Press, 2005.
- Richard Panek, “Going Over the Dark Side,” Sky and Telescope, Feb. 2009, p.22.