The Habitable Planet: A Systems Approach to Environmental Science
Risk, Exposure, and Health Online Textbook
1. Introduction
Unit 6 // Section 1
Kayla is a normal teenager except she has asthma, a chronic condition of the airways that makes it difficult for her to breath at times. Allergens such as pollens, dust mites, cockroaches, and air pollution from cigarettes, gas stoves, and traffic make asthmatics’ airways swell so that only limited amounts of air can pass through and respiration becomes a struggle akin to breathing through a tiny straw.
Growing up poor and black in Boston, Kayla is part of an epidemic that has seen the asthma prevalence rate for children rise from 3.6 percent in 1980 to 5.8 percent in 2005 (footnote 1). Asthma incidence has risen in many industrialized countries around the world (Fig 1), but it is much more common among children living in inner cities. Children like Kayla living in Roxbury and Dorchester, Massachusetts, are five times more likely to be hospitalized for asthma than children living in wealthier white sections of Boston.
Figure 1. Inner-city ER admissions for pediatric asthmatics
Source: Courtesy of the Environmental Health Office at the Boston Public Health Commission.
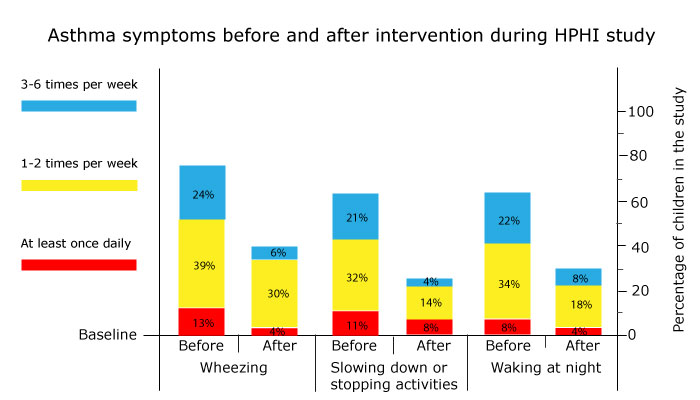
Starting in 2001, the Healthy Public Housing Initiative (HPHI), a collaboration between Harvard, Tufts, and Boston University, worked with the Boston housing authority and tenant organizations to conduct test interventions aimed at reducing the suffering of children with asthma. HPHI reduced allergen exposures by thoroughly cleaning apartments, educating mothers about pest controls, implementing integrated pest management (discussed in Unit 7, “Agriculture”), and providing dust-mite reducing mattresses. Symptoms decreased and quality of life measurements improved for Kayla and other asthmatic children living in three public housing developments during a year of follow-up assessments after the interventions (Fig. 2) (footnote 2).
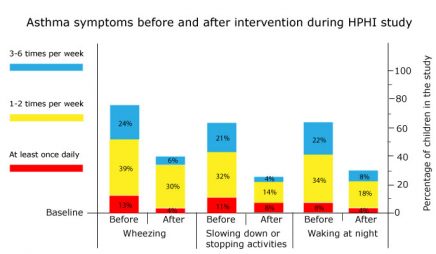
Figure 2. Change in asthma symptoms among children participating in HPHI before and after intervention
Source: Data courtesy of Jonathan I. Levy, Sc.D., Harvard School of Public Health.
We are exposed to environmental contaminants from conception to our last breath. Some of these materials are naturally-occurring substances such as dust, pollen, and mold, while others are manmade chemicals used for numerous industrial and commercial purposes. As of 2006, the U.S. Environmental Protection Agency (EPA) estimated that about there were 15,000 chemicals in commerce (footnote 3).
Some contaminants have been demonstrated to have harmful effects on various human organs, such as the reproductive or respiratory systems, or on functions such as fetal development. Based on evidence from toxicological, ecological, and epidemiological studies, health experts suspect many more contaminants of being possible risks to humans. The EPA screens chemicals that it believes are the greatest potential threats to human health and the environment, but most of the chemical compounds that are already in wide use today have been subject to little or no toxicological testing. Virtually none has been tested for potential as endocrine disruptors.
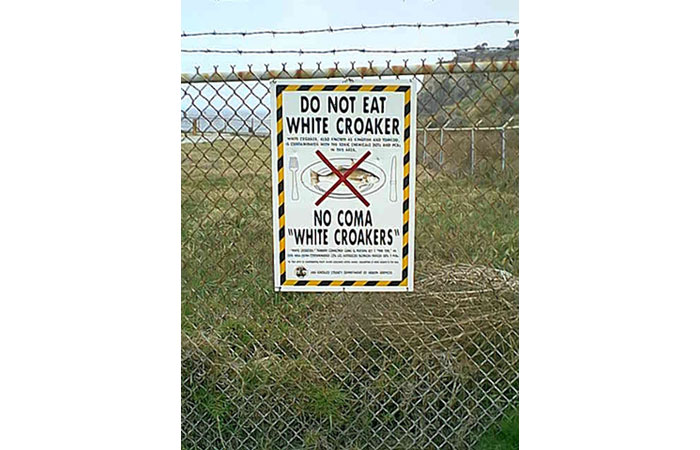
In complex modern societies, the most critical environmental health challenge is defining a balance between the social and economic benefits that materials and technologies provide on one hand and risks to public health on the other hand. Numerous materials, from food additives to pesticides to manufacturing inputs, have valuable uses but may also threaten the health of the general public or smaller high-risk groups. In many cases such threats can be managed by setting usage guidelines or limiting exposure. In extreme cases they may require taking materials off of the market. Tetraethyl lead, asbestos, DDT, and PCBs are some examples of widely used substances that have been proven harmful (Fig. 3).
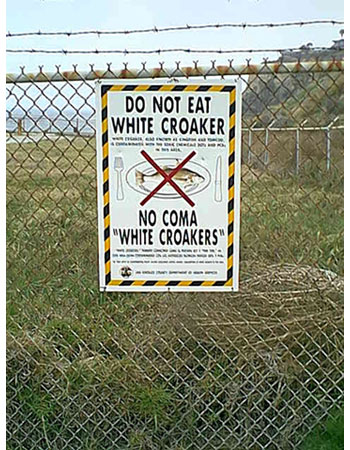 Figure 3. Warning sign, Palos Verdes Peninsula, California
Source: Courtesy United States Environmental Protection Agency.
Health experts approach these tradeoffs by using risk assessment to systematically evaluate scientific, engineering, toxicological, and epidemiological information on specific environmental hazards. Next they use this factual analysis to develop strategies, such as standards, regulations, and restrictions, that reduce or eliminate harm to people and the environment, a process referred to as risk management. Risk management takes into consideration both the benefits and the costs of controlling or eliminating hazards. It weighs the strength of the scientific evidence along with the social and economic implications of controlling or not controlling environmental risks.
This process has limitations. Epidemiological studies cannot establish causal relationships between exposure and harm. Most toxicological studies carried out in laboratories use artificially high doses to evoke responses within reasonable time periods, whereas real exposures to environmental contaminants often involve low-level exposures over very long time frames. And real exposures almost always involve mixtures of contaminants, such as heavy metals in mine drainage. The time course of exposures and doses is complex, both for individuals and for the population at large: levels, frequency, and intensity of exposure all can affect toxicity.
“We have very good ideas of what individual toxicants can do to people. However, you cannot predict what the ultimate human health impacts might be from simply knowing what the individual toxicants can do. Mixtures can interact in ways that are unforeseen and give you toxic ramifications that are much greater than what can be predicted from the single exposures. On the other hand, in some mixtures toxicants can cancel each other out. So this has to be studied well and properly to understand what the real risks are.”
Howard Hu, University of Michigan/Harvard University
Genetic variability in the population adds to the uncertainty of risk assessment. Interactions between humans’ genetic makeup and their environment take many forms, including characteristics that either protect individuals from specific risks or make them more susceptible. Both inherited genetic traits and environmental exposures can create genetic susceptibilities, which can then be transferred from one generation to another.
To be effective, risk management must take these uncertainties and sources of variability into account in developing strategies. Managing risks also involves political and philosophical issues. Governments have often acted regardless of the actual magnitude of a risk because of risk perceptions on the part of special interest groups or the general public.
This unit describes the risk assessment process and the central role of epidemiology—studying associations between exposure, risk factors, and outcomes. It then shows how public health experts use evidence to assess cancer and noncancer risks associated with environmental exposures. Next we look at the challenge of balancing risks and benefits and of assigning economic value to proposed environmental actions. The unit concludes with a discussion of the Precautionary Principle, a sometimes-controversial approach to managing health and environmental risks with incomplete knowledge, and with brief summaries of relevant laws and regulations.
2. Risk Assessment
Unit 6 // Section 2
Risk assessment is the process of establishing risks to humans and the environment from chemicals, radiation, technologies, or other contaminants and agents that can affect health and well-being. It is part of a broader process called risk analysis that also includes developing policies to manage risks once they are identified and quantified.
As summarized by the Society for Risk Analysis, a professional association of experts, “Risk analysis uses observations about what we know to make predictions about what we don’t know. Risk analysis is a fundamentally science-based process that strives to reflect the realities of Nature in order to provide useful information for decisions about managing risks . . . . [It] seeks to integrate knowledge about the fundamental physical, biological, social, cultural, and economic processes that determine human, environmental, and technological responses to a diverse set of circumstances” (footnote 4).
Health and environmental experts use risk analysis to assess many types of threats, from infectious agents to noise pollution. The process has several components (Fig. 4).
- Risk assessment: Scientists identify hazards, determine dose-response relationships, and estimate actual or projected exposures. These steps lead to an estimate of overall risk to the general population or target groups.
- Risk management: Experts develop options for limiting estimated risk. Unlike risk assessment, which is based on scientific findings, risk management takes political and economic factors into account along with technical considerations.
- Risk communication: Policy makers discuss the problem and options for addressing it with the public, then incorporate the feedback that they receive into their decisions. As discussed below in section 7, “Benefit-Cost Analysis and Risk Tradeoffs,” effective risk communication helps to ensure that decisions will be broadly acceptable.
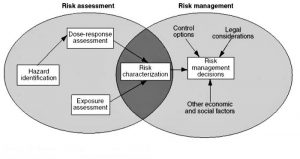
Figure 4. The risk assessment/risk management paradigm
Source: Courtesy United States Environmental Protection Agency, Office of Research and Development.
Risk assessment has been in use since the 1950s but has become more sophisticated and accurate over the past several decades, due in large part to increasing interest from government regulators. In the 1960s and 1970s, federal authority to regulate threats to health, safety, and the environment expanded dramatically with the creation of new oversight agencies such as the Environmental Protection Agency (EPA) and the Occupational Safety and Health Administration (OSHA), along with adoption of numerous laws regulating environmental hazards. At the same time, improved testing methods and better techniques for detecting contaminants made it easier to study relationships between exposure and health effects.
These developments made it easier in some ways to protect public health and the environment, since regulators at the new agencies had broad mandates for action and abundant data about potential threats. But regulators had to allocate their resources among many competing issues, so they needed tools to help them focus on the most dangerous risks. Former EPA administrator William K. Reilly recalls, “Within the space of a few years, we went to the possibility of detecting not just parts per million but parts per billion and even, in some areas, parts per quadrillion . . . . That forces you to acknowledge that what you need is some reasonable method for predicting levels of real impact on humans so that you can protect people to an adequate standard” (footnote 5).
As an illustration of the power of modern analytical methods, Figure 5 shows results from a X-ray analysis of a strand of composer Ludwig van Beethoven’s hair performed in the year 2000 by the U.S. Department of Energy’s Argonne National Laboratory. The experiment found lead levels of about 60 parts per million in Beethoven’s hair, compared to less than six parts per million for an average U.S. human hair today, indicating that some of Beethoven’s lifelong illnesses may have been due to lead poisoning.
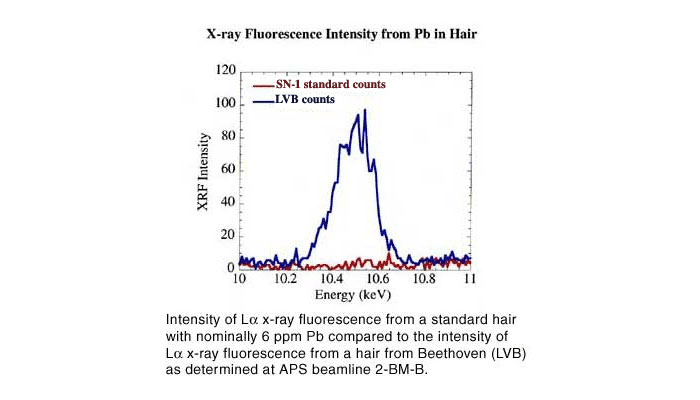
Figure 5. X-ray fluorescence intensity from Pb in hair
Source: Courtesy United States Department of Energy, Argonne National Lab.
Risk analysis gave scientists and regulators a way to sort through the vast amounts of health information provided by methods like that illustrated in Fig. 5, compare relative risks from various contaminants, and set priorities for action. By the mid-1970s a number of federal agencies were carrying out risk assessments, each using its own procedures and standards.
To address concerns about inconsistencies among agencies, Congress requested a study from the National Academy of Sciences, which in 1983 published a seminal report, Risk Assessment in the Federal Government: Managing the Process (often referred to as the “Red Book”) (footnote 6). This study provided a general framework for cancer risk assessment and recommended developing uniform risk assessment guidelines for agencies. Although no government-wide guidelines have been produced, EPA has produced numerous assessments of human health risks from exposure to substances such as air pollutants and drinking water contaminants. The Office of Management and Budget, which oversees U.S. regulatory policies, requires EPA and other federal agencies to submit comprehensive risk assessments and benefit-cost analyses along with proposed rule makings and regulations.
Following a model outlined in the Red Book, environmental risk assessments typically include four steps.
- Hazard identification: Determining whether or not exposure to an agent causes health problems. Researchers often address this question by testing the agent to see whether it causes cancer or other harmful effects in laboratory animals.
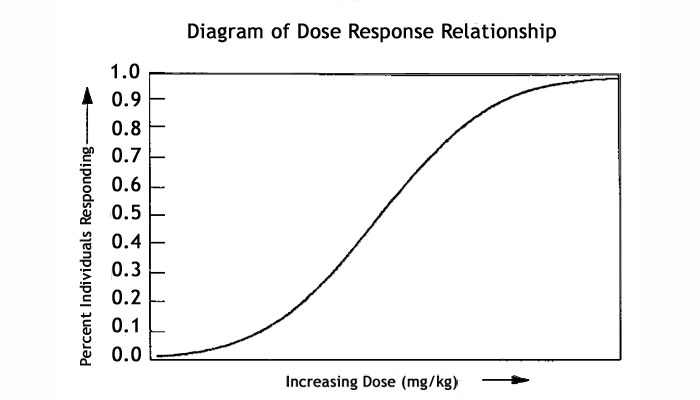
- Dose-response assessment: Characterizing the relationship between receiving a dose of the agent and experiencing adverse effects. Analysts often have to extrapolate from high laboratory doses to low actual doses and from laboratory animals to humans.
- Exposure assessment: Measuring or estimating how often humans are exposed to the agent, for how long, and the intensity of exposure. This can involve methods such as asking subjects about their lifestyles and habits; taking environmental samples; and screening subjects’ blood, urine, hair, or other physical samples to measure concentrations of the agents in their bodies (Fig. 6).
- Risk characterization: Combining exposure and dose-response assessments to estimate health impacts on subjects.
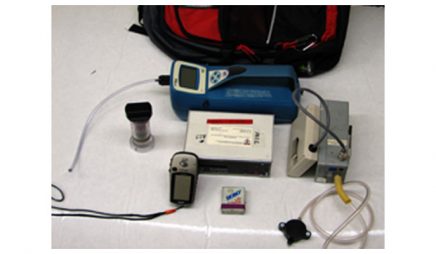
Figure 6. Backpack system for measuring exposure to fine particulate air pollution
Source: John Spengler, Harvard School of Public Health.
3. Measuring Exposure to Environmental Hazards
Unit 6 // Section 3
Many hazardous materials are present in our environment, but some are more likely to cause actual harm than others. Humans come into contact with harmful agents in many ways. For example, we may inhale gases and particulates as we breathe, eat fruit that carries pesticide residues, drink polluted water, touch contaminated soils, or absorb radiation or chemical vapors through our skin. In each case, risk analysts want to measure several variables.
- Exposure: Contact between a contaminant and the exterior of an exposed person’s body (skin and openings into the body such as mouth, nostrils, and cuts or breaks in the skin).
- Intake or uptake: The processes through which contaminants cross the boundary from outside to inside the body. Intake refers to processes like ingestion and inhalation that physically move the agent through an opening in the outer body, such as the mouth, nose, or a skin puncture. Uptake involves absorption of agents through the skin.
- Dose: The amount of contaminant that is inhaled or ingested into an exposed person’s body or applied to the skin (potential dose), and the fraction of this dose that is absorbed and becomes available to impact biologically significant sites inside the body (internal dose) (footnote 7).
Exposure assessments describe how frequently contact occurs, how long it lasts, its intensity (i.e., how concentrated the contaminant is), and the route by which contaminants enter the body (Fig. 7). They may also estimate dose, although if there is a known relationship between exposure to a specific hazard and how the body responds, a study may simply estimate the target group’s exposure and use existing knowledge to calculate the average dose members have received.
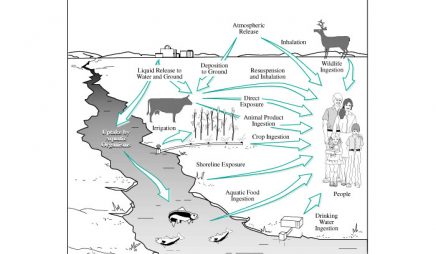
Figure 7. Exposure pathways for radioactive chemicals and materials from a nuclear waste storage facility
Source: Courtesy United States Department of Energy/Hanford Site.
As this summary indicates, exposure assessment is a painstaking multi-step process that requires a lot of data. Researchers need to know the contaminant’s physical and chemical properties, the form in which it occurs locally, the medium by which it comes into contact with humans, and how concentrated it is within that medium. They also need to know the demographics of the exposed population, major routes of exposure for that group, and relevant behavior and lifestyle issues, such as how many people smoke cigarettes or filter their tap water. And calculating the human impact of contact with hazardous agents requires detailed knowledge of physiology and toxicology.
Even when people ingest a contaminant or absorb it through their skin, much analysis is required to determine how they may be affected. Once an internal dose of a chemical is absorbed into the bloodstream, it becomes distributed among various tissues, fluids, and organs, a process called partition. Depending on the contaminant’s physical and chemical properties, it can be stored, transported, metabolized, or excreted. Many contaminants that are highly soluble in water are excreted relatively quickly, but some, such as mercury, cadmium, and lead, bind tightly to specific organs. Agents that are not highly soluble in water, such as organochlorine insecticides, tend to move into fatty tissues and accumulate.
The portion of an internal dose that actually reaches a biologically sensitive site within the body is called the delivered dose. To calculate delivered doses, researchers start by mapping how toxic substances move through the body and how they react with various types of tissues. For example, combustion of diesel fuel produces a carcinogenic compound called 1,3-butadiene. When humans inhale this colorless gas, it can pass through the alveolar walls in the lungs and enter the bloodstream, where it binds readily to lipids and is likely to move to other parts of the body. Experimental studies have shown that subjects who ate ice cream with a high fat content a few hours before inhaling low concentrations of 1,3-butadiene had reduced levels of the compound in their exhaled breath, demonstrating that more of the gas could partition to the lipid fraction of the body.
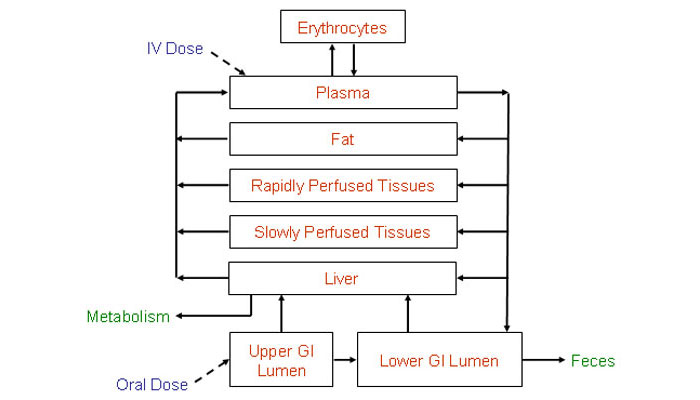
The delivered dose is the measurement most closely related to expected harms from exposure, so estimating delivered doses is central to exposure assessment. The most common methods are measuring blood concentrations or using PBPK (Physiologically-Based Pharmacokinetic) models. This approach simulates the time course of contaminant tissue concentrations in humans by dividing the body into a series of compartments based on how quickly they take up and release the substance. Using known values for physical functions like respiration, it estimates how quickly the agent will move through a human body and how much will be stored, metabolized, and excreted at various stages. Figure 8 shows a conceptual PBPK model (without calculated results) for intravenous or oral exposure to hexachlorobenzene, a synthetic pesticide.
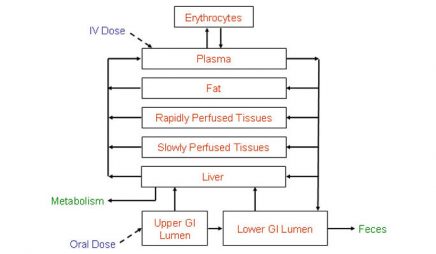
Figure 8. Conceptual PBPK model for hexachlorobenzene exposure
Source: Colorado State University /computox.colostate.edu/tools/pbpk.
Even when it relies on techniques like PBPK modeling, exposure assessment requires analysts to make assumptions, estimates, and judgments. Scientists often have to work with incomplete data. For example, in reconstructing exposures that have already taken place, they have to determine how much of a contaminant may have been ingested or inhaled, which can be done by interviewing subjects, analyzing their environment, or physical testing if exposure is recent enough and the contaminant leaves residues that can be measured in blood, hair, or other biological materials. Some contaminants are easier to measure precisely in the environment than others, and relevant conditions such as weather and soil characteristics may vary over time or across the sample area.
To help users evaluate their results, exposure assessments include at least a qualitative description (plus quantitative estimates in some cases) of uncertainty factors that affect their findings. Addressing uncertainty ultimately makes the process of risk analysis stronger because it can point out areas where more research is needed and make a individual study’s implications and limitations clear. As the EPA states in its current exposure assessment guidelines, “Essentially, the construction of scientifically sound exposure assessments and the analysis of uncertainty go hand in hand” (footnote 8).
4. Using Epidemiology in Risk Assessment
Unit 6 // Section 4
When scientists perform risk analyses, the best source of information on specific contaminants’ health effects is data from epidemiologic studies. Epidemiologists analyze how health-related events are distributed in specific human populations—who gets sick with what illnesses, when, and where. By comparing groups with different illness rates and looking at demographic, genetic, environmental, and other differences among these groups, epidemiologists seek to determine how and why certain groups get sick. These studies are designed to inform public health policies and help prevent further harm.
Epidemiologists may consider many possible determinants to explain patterns of illness, including physical, biological, social, cultural, and behavioral factors. In each case, they seek to explain associations between certain exposures, risk factors or events, and illnesses or outcomes. Over the past half-century epidemiological studies have documented linkages between smoking and lung cancer, intravenous drug use and HIV/AIDS infection, and poor indoor air quality and health problems, to cite just a few examples.
To explore these associations, analysts have two basic study design options. Cohort studies follow a group of individuals who share some common characteristic such as age, place of residence, or exposure to a hazard, and study the frequency of illness in this group to see how strongly certain risk factors are associated with becoming sick. Researchers may also follow a control group that does not share the common factor with the cohort that is the study’s subject. Whether they involve one group or two, cohort studies start with exposures and follow subject through time to find the outcomes.
For example, scientists have studied survivors of the Hiroshima and Nagasaki bombings to see how atomic bomb radiation exposure affects cancer rates in survivors and the incidence of genetic effects in survivors’ children. Researchers in the Framingham Heart Study, launched in 1948, have assessed over 10,000 participants from Framingham, Massachusetts, spanning several generations to identify major risk factors for cardiovascular disease (Fig. 9). Many epidemiologic studies focus on workplace exposures, which are generally higher and more frequent than other human exposures to environmental contaminants and therefore are more likely to show associations between exposure and illness.

Figure 9. Four generations from one family participating in the Framingham Heart Study and associate studies
Source: Tobey Sanford.
In contrast, case-control studies enroll a group of people who already have the disease of interest (the case group) and a group of people who do not have the disease but match the case group members as closely as possible in other ways (the control group). Researchers then work backwards to identify risk factors that may have caused the case group to get sick, and compare the groups to test how strongly these risk factors are associated with illness. Case-control studies start with the outcome and look backward to explain its causes.
In an early example of a case-control study, anesthesiologist John Snow investigated an 1854 cholera epidemic in London by mapping where victims lived, then marking the sites of public water pumps on the map (Fig. 10). Unlike area health authorities, Snow believed that contaminated water was a source of infection. Pump A, the Broad Street Pump, lay at the center of a cluster of cholera cases. Snow determined through interviews that other nearby pumps, which he labeled B and C, were used much less frequently than the Broad Street pump, and that all of the local cholera patients had consumed water from Pump A. Accordingly, Snow concluded that Pump A was the source of the infection. When he convinced local officials to remove the pump handle, cholera cases (which were already declining) stopped (footnote 9).

Figure 10. Snow’s original map (shows cases of cholera around water pumps)
Source: Courtesy Wikimedia Commons. Public Domain.
Each of these approaches has strengths and weaknesses. Cohort studies let researchers see how outcomes develop over long periods of time, but they require large groups to make the findings statistically significant and are expensive to administer. Case-control studies are a more effective way to study rare diseases, since researchers can select members of the exposed group instead of waiting to see which members of a cohort contract the disease, and are quicker and less expensive than cohort studies. However, since they usually look backward in time to reconstruct exposures, results may be skewed by incomplete data or participants’ biased recollections.
Even if an exposure and a disease are associated, researchers cannot automatically assume that the exposure causes the disease. In 1965, pioneering British epidemiologist and statistician A.B. Hill proposed nine criteria for citing causal relationships between environmental threats and illness.
- Strength: Groups exposed to the threat have much higher rates of illness than unexposed groups.
- Consistency: The association is detectable consistently in different places, times, and circumstances by different observers.
- Specificity: The association is limited to well-defined groups, particular situations, and specific illnesses.
- Temporality: It is clear over time that the threat occurs first and leads to the outcome.
- Biological gradient: A consistent relationship exists between the size of dose and the scale of response.
- Plausibility: The proposed causal relationship makes biological sense.
- Coherence: The relationship does not conflict seriously with existing historical and scientific knowledge of the disease.
- Experiment: An experimental step (such as shutting down the Broad Street Pump) produces results that support the existence of a causal relationship.
- Analogy: The association is similar to documented causal relationships between threats and diseases (footnote 10).
What if the risk comes from a chemical that has not been studied yet, or has only been studied in a few small groups? In such cases analysts use information from animal toxicology studies, which can measure associations between contaminants and health effects in thousands of animal subjects quickly and inexpensively (relatively speaking—major animal studies can take several years and cost millions of dollars).
But animal data also has its drawbacks. Toxicology studies typically use large doses to produce a measurable response quickly, while environmental exposures usually occur at low levels over long periods of time, so analysts have to extrapolate from high study doses to low real-world doses. They also have to extrapolate from observed results in animals to expected results in humans, which assumes that a contaminant will affect humans in the same way. However, epidemiology and animal studies can inform each other. For example, if epidemiologic studies show that workers in a specific industry are developing cancer at higher than normal rates, researchers may carry out animal studies to see whether a specific material that those workers use causes illness.
5. Cancer Risk
Unit 6 // Section 5
Cancer is a major focus of environmental risk analysis for several reasons. First, it is a leading cause of death in developed countries that have passed through the demographic transition and brought other threats such as infectious disease and malnutrition under control (for more details, see Unit 5, “Human Population Dynamics”). Various types of cancer account for 25 percent or more of yearly deaths in the United States and other industrialized nations. Cancer rates are also increasing in the developing world.
Second, environmental exposures broadly defined account for a substantial fraction of cancers—at least two-thirds of all cases in the United States, according to the National Institutes of Health (footnote 11). This estimate includes all influences outside the body, including many lifestyle choices such as smoking and eating a high-fat diet. Tobacco use alone causes about one-third of all annual U.S. cancer deaths, while inactivity and obesity together cause an estimated 25 to 30 percent of several major types of cancer (footnote 12).
In contrast, the narrower category of exposure to environmental pollutants causes about 5 percent of annual U.S. cancer deaths (footnote 13). However, these risks are not spread equally across the population. They have higher impacts on heavily-exposed groups—for example, workers in industries that use known or possibly carcinogenic substances or communities that draw their drinking water from a contaminated source. Environmental exposures also can cause gene alterations that may lead to cancer over time.
Risk analyses have led to bans or use restrictions on carcinogens such as benzene (a solvent), asbestos (an insulating fiber), and a number of pesticides, and have contributed to the development of guidelines and workplace standards that minimize exposure to other known or suspected carcinogens. Figure 11 shows one example, an illustration from an EPA brochure on reducing radon gas levels in houses. Exposure to radon, a natural byproduct of radioactive elements decaying in surrounding soil, causes an estimated 20,000 lung cancer deaths in the United States annually.

Figure 11. Techniques for reducing home radon gas levels
Source: Courtesy United States Environmental Protection Agency.
The Environmental Protection Agency and other regulators quantify cancer risks as probabilities—the number of excess individual lifetime cases of cancer (beyond those that could be expected to occur on average in the population) that will occur in response to a specific exposure. For example, in 1999 EPA estimated that the added cancer risk from polychlorinated biphenyl (PCB) pollution in the upper Hudson River was one additional case of cancer for every 1,000 people who ate one meal per week of fish caught in that section of the river (footnote 14). As this approach suggests, not everyone exposed to a hazard becomes ill, but exposure increases the likelihood of suffering harmful effects.
EPA’s traditional classification system for carcinogens combines human data, animal data, and other supporting evidence to characterize the weight of evidence regarding whether a substance may cause cancer in humans (Table 2). However, these rankings are based on levels of certainty that agents may cause cancer, not on relative levels of risk from one substance versus another, so other materials not currently classified as carcinogens may be equally hazardous. Some materials are classified as possible or probable carcinogens because they have not been studied thoroughly enough yet to make a determination about whether they cause cancer in humans (footnote 15).
| Human Evidence | Animal Evidence | ||||
|---|---|---|---|---|---|
| Sufficient | Limited | Inadequate | No Data | No Evidence | |
| Sufficient | A | A | A | A | A |
| Limited | B1 | B1 | B1 | B1 | B1 |
| Inadequate | B2 | C | D | D | D |
| No Data | B2 | C | D | D | E |
| No Evidence | B2 | C | D | D | E |
Group A Human carcinogen
Group B Probable carcinogen
B1 Limited evidence of carcinogenicity from epidemiology studies
B2 Inadequate human evidence but positive animal evidence
Group C Possible human carcinogen
Group D Not classifiable as to human carcinogenicity
Group E Evidence of noncarcinogenicity for humans
One of the most controversial issues in cancer risk assessment is whether the dose-response relationship for all carcinogens is linear. Most risk analyses assume that the answer is yes—in other words, that exposure to any amount of a carcinogen produces some risk of cancer, with risk increasing in proportion to the size of the dose. Under this approach, risk is estimated using the equation
Risk = LADD x CSF
where risk is the unitless probability of an individual developing cancer, LADD is the lifetime average daily dose per unit of body weight (milligrams per kilogram of body weight per day), and CSF is the cancer slope factor, or the risk associated with a unit dose of a carcinogen, also called the cancer potency factor (mg/kg-day)-1. The CSF usually represents an upper bound estimate of the likelihood of developing cancer, based on animal data (footnote 16).
Assuming a linear dose-response relationship has major implications for regulating carcinogens because it indicates that even very low exposure levels can be hazardous and thus may need to be controlled. However, cancer research findings over the past several decades indicate that some carcinogens may act in non-linear ways. For example, radon damages the DNA and RNA of lung cells, but the long-term risk associated with exposure to radon is much higher for smokers than for non-smokers, even if their exposures are the same. Another chemical, formaldehyde CSF, is under review by EPA because it has been shown that before animals exposed to high doses developed cancer, they developed ulcerations in their mucous membranes. This observation suggests that lower concentrations of formaldehyde CSF, a water soluble compound, had a different potency factor than higher concentrations.
Further complicating the issue, juvenile test animals are more susceptible to some cancer causing compounds than adult animals of the same species. EPA’s cancer risk guidelines now reflect this difference. On the other hand, it is understood that the human body’s ability to repair damaged DNA diminishes with age. Age-dependent cancer slope factors are not available for the hundreds of suspected cancer causing compounds, so the unit risk factors are assumed to apply uniformly over a lifetime, except where observations support a different risk for infants and children.
These questions can influence what type of model scientists use to calculate dose-response relationships for carcinogens, or even whether carcinogens are treated similarly to non-cancer endpoints with presumed population thresholds (as described below). A common model for dose-response for carcinogens is the so-called one-hit model, which corresponds to the simplest mechanistic explanation of cancer—that a single exposure to a dose as small as a molecule would have a non-zero probability of changing a normal cell into a cancer cell. Researchers typically use this model to analyze pollutants that are hypothesized to operate under this mode of action or as a default model in the absence of mechanistic evidence.
In contrast, multi-stage models (of which the one-hit model is a special case) assume that a cell passes through several distinct phases that occur in a certain order as it becomes cancerous. It is hard to determine empirically which model is more appropriate, so this choice relies on understanding the mode of action of the compound. Because CSF values are sensitive to these assumptions, EPA’s newest carcinogen risk guidelines (issued in 2005) focus on finding a point in the range of observed data, called a point of departure, which is less sensitive to model choice. For compounds that are direct mutagens or with substantial background processes, linearity is assumed below the point of departure, while non-linear approaches are used if suggested by the mode of action.
6. Other Risks
Unit 6 // Section 6
Environmental contaminants cause many harmful effects in addition to cancer, such as toxicity, birth defects, reduced immune system function, and damage to other organs and physical systems. For noncarcinogens, researchers assume that a threshold exists below which no harmful effects are likely to occur in humans. To quantify these values, scientists first seek to identify the so-called no observable adverse effects level (NOAEL), which is the highest exposure among all available studies at which no toxic effect was observed. Next they divide the NOAEL by one or more uncertainty factors, typically ranging from 10 to 1,000, based on the quality of the data that was used to measure the NOAEL and on how close the NOAEL is to estimated human exposures.
From these calculations, EPA sets reference doses for ingestion and reference concentrations for inhalation that represent levels at which humans can be exposed to chemicals for specific periods of time without suffering adverse health effects. These limits are fairly conservative because they incorporate uncertainty factors and assume that people may be exposed daily or constantly throughout their lives. Box 1 shows EPA’s core health assessment figures for noncarcinogenic effects of paraquat, a widely-used and highly toxic herbicide.
Box 1. Chronic health hazard assessment of paraquat for noncarcinogenic effects
Critical effect: chronic pneumonitis (lung inflammation)
No observed effects level (NOEL): 0.45 mg/kg-day
Uncertainty factor: 100 to account for inter- and intraspecies difference in extrapolating from laboratory animals (dogs) to humans
Reference dose for oral exposure: 4.5 x 10⁻³ mg/kg-day
[Source: EPA, Integated Risk Information System, http://cfpub.epa.gov/iris/quickview.cfm?substance_nmbr=0183]
Regulators also set limits for specific types of exposures. For example, the EPA establishes guidelines for pesticide residues in food, and the Agency for Toxic Substances and Disease Registry establishes minimal risk levels (MRLs) for acute, intermediate, and chronic exposure to contaminants at hazardous waste sites.
The EPA’s peer-reviewed assessments of human health effects (both cancer and non-cancer) from exposure to chemicals are available through the agency’s Integrated Risk Information System (IRIS) (footnote 17). These reports include descriptive and quantitative information on specific chemicals that cause cancer and other chronic health effects. Analysts can use this information along with exposure information to characterize public health risks from specific chemicals in specific situations and to design risk management programs.
The state of California has developed a similar list in compliance with Proposition 65, a 1986 ballot measure that required the state to publish a list of chemicals known to cause cancer, birth defects, or reproductive harm (footnote 18). Chemicals can be listed in three ways: if they are shown to cause cancer, birth defects, or reproductive harm by either of two state expert committees; if they are so identified by EPA, certain other U.S. regulatory agencies, or the International Agency for Research on Cancer; or if a state or federal agency requires them to be labeled as causing these effects (substances in this category are mainly prescription drugs).
Companies that do business in California must provide “clear and reasonable” warning before knowingly and deliberately exposing anyone to a listed chemical, unless exposure is low enough to pose no significant health risks. They also are barred from discharging listed chemicals into drinking water sources. The intent of Proposition 65 is to increase awareness about the effects of exposure to listed chemicals, enable Californians to reduce their exposure, and give manufacturers an incentive to find substitutes for listed chemicals. The law has led to removal of many toxic substances from commerce, including faucets and tableware that contained lead.
7. Benefit-Cost Analysis and Risk Tradeoffs
Unit 6 // Section 7
Why are so many hazardous materials widely used in technology and commerce? Simply put, they also deliver benefits. For example, lead was used for decades as a gasoline additive in the United States (and is still used in developing countries) because it reduces “knocking,” or pinging in the engine from premature fuel combustion. In many cases the full human health impacts of such materials were not known at the time when they entered use but only became clear years later, when they were common ingredients of commercial products.
When risk analysis shows that a material poses serious human health risks, policy makers often carry out formal economic analyses of risk reduction options. This involves setting an economic value on lives saved and injuries or illnesses avoided through policy actions, so that decision makers can compare these health benefits to the cost of proposed regulations. Most major environmental laws do not require use of cost-benefit analysis. For example, the Clean Air Act directs regulators to set national air quality standards that scientific evidence indicates will protect public health. One exception, the Safe Drinking Water Act, was amended in 1996 to require cost-benefit analysis of new standards.
Currently the federal Office of Management and Budget requires U.S. government agencies to do cost-benefit analyses of regulations that are expected to have economic impacts (positive or negative) of $100 million or more—some 50 to 100 rules annually (footnote 19).
One widespread method for monetizing health benefits is called hedonic valuation—analyzing what people are willing to pay to live in an unpolluted area or willing to accept as a salary premium for working in a risky industry. Economists often calculate these values by looking at what workers earn in high-risk industries compared to less-dangerous fields (Fig. 12) or by comparing housing prices in polluted and clean areas. This method is also called the revealed-preference approach, on the assumption that society strikes balances between risks and benefits that are reflected in economic decisions.

Figure 12. Commercial king crab fisherman, Alaska
Source: Alaska Division of Community and Business Development.
In a survey of more than 30 risk premium studies conducted in U.S. workplaces between 1974 and 2000, W. Kip Viscusi and Joseph Aldy found that the average calculated value of a statistical life (VSL) was about $7 million. One way to think about this figure is to imagine a population of 1 million people who are considering a regulation that would result on average in one fewer death from cancer each year. If each member of the group is willing to pay $7 per year as a cost of imposing that regulation, the value of a statistical life in that society can be said to be $7 million. This figure measures the collective value placed on reducing a generalized risk, not the value of any actual person’s life. EPA guidelines recommend using a value of $6.2 million for regulatory impact analyses, while some other agencies use lower values (footnote 20).
Analysts also monetize the benefits of regulations by measuring costs that those regulations can be expected to avoid, such as medical bills, lost wages due to illness and disability, and special aid programs for children born with birth defects due to exposure. Table 3 lists health effects considered by EPA in a 2006 regulatory impact analysis in support of national limits for fine particulate air pollution (some effects were not quantified because of limitations in data or methods).
| Quantified and Monetized Effects | Unquantified Effects |
|---|---|
| Premature mortality, based on cohort study estimates | Low birth weight |
| Bronchitis (chronic and acute) | Pulmonary function |
| Hospital admissions: respiratory and cardiovascular | Chronic respiratory diseases other than chronic bronchitis |
| Emergency room visits for asthma | Nonasthma respiratory emergency room visits |
| Nonfatal heart attacks | UVb exposure (may result in benefits or disbenefits) |
| Lower and upper respiratory illness | |
| Minor restricted-activity days | |
| Work loss days | |
| Asthma exacerbations (asthmatic population) | |
| Respiratory symptoms (asthmatic population) | |
| Infant mortality |
Cost-benefit analyses also set values on environmental impacts, such as improved visibility in scenic areas or protection of undeveloped land as wilderness. Sometimes monetizing these effects is straightforward because people pay for access to the resource and demand is likely to drop if the resource becomes less attractive. For example, researchers have assessed the economic impact of air pollution in national parks by measuring how sharply pollution events reduce visits to parks and calculating the resulting lost revenues, both at the park and in surrounding communities.
Contingent valuation is a less direct approach that involves asking people what they would theoretically be willing to pay for an environmental good. This method is often used to estimate demand for a resource for which a market does not currently exist. For example, if a power company proposes to dam a wild and scenic river to produce electricity, analysts might ask ratepayers whether they would be willing to pay higher rates for electricity from another, more expensive source to keep the river undeveloped. It can be hard to estimate accurate values with this method, which has generated a vast economic literature, but well-designed willingness-to-pay studies can provide reasonable indications of how highly the public values specific environmental benefits.
Many risk-management choices involve risk-risk tradeoffs—choosing between options that each may cause some harm. We make risk-risk tradeoffs every day. Some are personal choices, such as pursuing an intensive exercise program which has cardiovascular benefits but could lead to injuries. Others involve broad social regulations. For example, some environmental groups support an international ban on the insecticide DDT because of its toxic human and animal health effects, but many public health agencies argue that this step would make it very difficult to control malaria in the developing world.
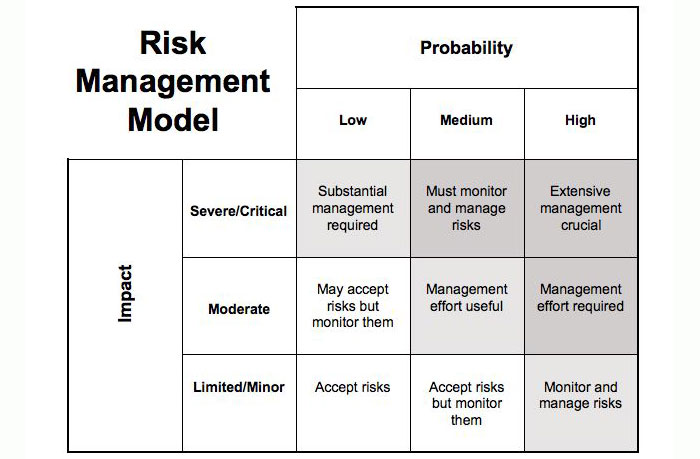
Regulators may consider many criteria when they confront risk-risk tradeoffs and have to decide which risks are and are not acceptable. Important factors include both the probability of a risk and whether its consequences would be negligible, moderate, or serious (Fig. 13).

Figure 13. Risk management model
A high-consequence event, such as a plane crash or a radiation release at a nuclear power plant, can merit intensive regulation even if the probability of such accidents occurring is very low. Conversely, risks that have high probability but low consequences for the general public—for example, injuries from slipping on icy sidewalks—can be addressed through lower-level actions, such as passing local ordinances that require property owners to clear their sidewalks. Once officials decide what level of risk is involved, cost-benefit analysis may influence their choice of responses if it shows that one policy will produce much greater benefits relative to costs than another policy.
8. Risk Perception
Unit 6 // Section 8
Expert assessments and public perceptions of risk are not always the same. Decision-makers need to understand factors that influence how people understand and interpret risk information for several reasons. First, public concerns may influence research and development priorities, such as which chemicals to analyze in toxicity studies. Second, individual behavior choices are guided by risk avoidance, so if experts want people to avoid certain risks, they need to understand whether the public sees those actions as dangerous. If the public views a risky activity as benign, officials may have to develop public-education campaigns to change those perceptions. Current examples include labels warning about health risks on cigarette packages and alcoholic beverage containers.
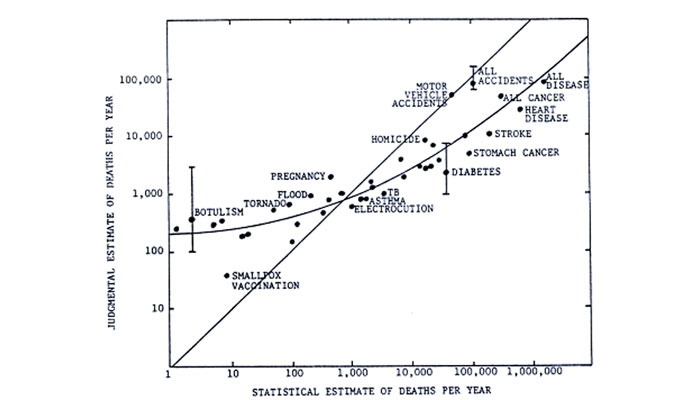
Behavioral and social scientists have compared risk perceptions among many different groups, including scientists’ views compared to those of laypersons, men compared to women, and differences among diverse ethnic and economic groups. One finding is that the general public overestimates the prevalence of some risks (such as those lying above the straight line in Fig. 14) and underestimates others (those lying below the line).
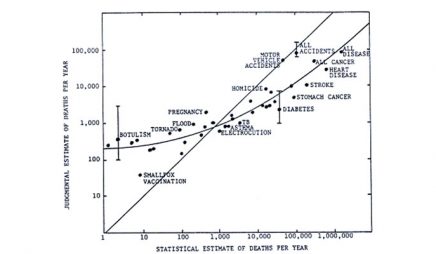
© Scope Report 27 – Climate impact assessment, Chapter 16, Figure 16.5, ed. by RW Kates, JH Ausubel, and M Berberi J Wiley & Sons Ltd, UK (1985). Adapted from: Slovic et al. Rating the risks. Environment, 21(3) 14-39 (1979).
Many people overestimate risks from high visible and sensational threats like tornadoes and underestimate risks from common illnesses such as cancer and heart disease.
Figure 14. Relationship between judged frequency and actual number of deaths per year
Source: Scope Report 27 – Climate impact assessment, Chapter 16, Figure 16.5, ed. by RW Kates, JH Ausubel, and M Berberian. J Wiley & Sons Ltd, UK (1985). Adapted from: Slovic et al. Rating the risks. Environment, 21(3) 14-39 (1979).
Laypeople judge risks differently from technical experts because they give greater weight to factors such as the potential for catastrophic damage, the likelihood of threats to future generations, and their own sense of whether they can control the risk. This can be seen in Table 4, which shows how technical experts and several sets of laypeople ranked the risk from a list of activities and technologies. Note, for example, that the expert group was much less worried about nuclear power but more worried about x-rays than laypeople. Both involve radiation exposure, but x-rays may have seemed less risky to the non-specialists because the scale of an x-ray is much smaller than a nuclear reactor accident and because people usually have a choice about whether to undergo x-rays.
| Activity or technology | League of Women Voters | College students | Active club members | Experts |
|---|---|---|---|---|
| Nuclear power | 1 | 1 | 8 | 20 |
| Motor vehicles | 2 | 5 | 3 | 1 |
| Handguns | 3 | 2 | 1 | 4 |
| Smoking | 4 | 3 | 4 | 2 |
| Motorcycles | 5 | 6 | 2 | 6 |
| Alcoholic beverages | 6 | 7 | 5 | 3 |
| General (private) aviation | 7 | 15 | 11 | 12 |
| Police work | 8 | 8 | 7 | 17 |
| Pesticides | 9 | 4 | 15 | 8 |
| Surgery | 10 | 11 | 9 | 5 |
| Firefighting | 11 | 10 | 6 | 18 |
| Large construction | 12 | 14 | 13 | 13 |
| Hunting | 13 | 18 | 10 | 23 |
| Spray cans | 14 | 13 | 23 | 26 |
| Mountain climbing | 15 | 22 | 12 | 29 |
| Bicycles | 16 | 24 | 14 | 15 |
| Commercial aviation | 17 | 16 | 18 | 16 |
| Electric power (nonnuclear) | 18 | 19 | 19 | 9 |
| Swimming | 19 | 30 | 17 | 10 |
| Contraceptives | 20 | 9 | 22 | 11 |
| Skiing | 21 | 25 | 16 | 30 |
| X-rays | 22 | 17 | 24 | 7 |
| High school/college football | 23 | 26 | 21 | 27 |
| Railroads | 24 | 23 | 29 | 19 |
| Food preservatives | 25 | 12 | 28 | 14 |
| Food coloring | 26 | 20 | 30 | 21 |
| Power mowers | 27 | 28 | 25 | 28 |
| Prescription antibiotics | 28 | 21 | 26 | 24 |
| Home appliances | 29 | 27 | 27 | 22 |
| Vaccinations | 30 | 29 | 29 | 25 |
Other factors can influence how both experts and laypeople perceive risks. Paul Slovic and other behavioral researchers have found that many Americans stigmatize certain industries, especially nuclear power and chemicals, which are widely viewed as repellent, disruptive, and dangerous. Conversely, scientists who work for industry tend to see chemicals as less threatening than do government and academic researchers (a phenomenon called affiliation bias). Ultimately, they argue, all groups bring their own assumptions to bear on discussions of risk.
Communicating risk information to the public is an important part of risk management. In the early decades of environmental regulation, public communication often took what critics called the “decide, announce, defend” approach: agencies developed policies and released their final results to the public and regulated industries. But since risk analysis involves many uncertainties, assumptions, and judgments, it requires policy makers to explain clearly how decisions are reached—especially if the issue involves risks that laypeople perceive differently from scientific experts.
Often effective risk communication means involving the public in the decision process, not just informing people at the end. Public involvement in risk decisions can take many forms. In early planning stages, it can help regulators identify the issues that citizens care most about, how much risk they will tolerate, and what they view as acceptable mitigation costs. Stakeholders may also take part in implementing decisions. For example, the Defense and Energy Departments have formed community advisory boards to help make decisions about cleaning up contaminated military bases and nuclear weapons production sites.
9. The Precautionary Principle
Unit 6 // Section 9
Under the basic risk analysis model, regulators quantify risks and compare the costs and benefits of various control options before they set limits on hazards. However, over the past several decades some governments have formally adopted a different approach called the Precautionary Principle as a guideline. This view holds that governments should not wait to limit contaminants in food, water, air, or commercial products until scientific studies have reduced uncertainties about exposure and effects.
Although the idea of “better safe than sorry” can be traced as far back in history as the Hippocratic Oath, the Precautionary Principle was first codified as an approach to environmental protection in West German national policies of the 1970s. References to a precautionary approach began to appear in international agreements in the 1980s and 1990s. The Wingspread Statement, a declaration drafted by government officials, attorneys, and labor and environmental advocates at an international conference in 1998, argued that existing environmental regulations (especially those based on risk assessment) did not protect human health and the environment well enough and that a new approach was required. “When an activity raises threats of harm to human health or the environment, precautionary measures should be taken even if some cause and effect relationships are not fully established scientifically. In this context the proponent of an activity, rather than the public, should bear the burden of proof,” the statement asserted.
The Precautionary Principle has taken root most strongly in the European Union (EU). In 2000 the EU issued a communiqué stating that the principle applied “where scientific evidence is insufficient, inconclusive, or uncertain and preliminary scientific evidence indicates that there are reasonable grounds for concern that the potentially dangerous effects on the environment, human, animal, or plant health may be inconsistent with the high level of protection chosen by the EU.” European regulators have invoked the Precautionary Principle to support steps such as banning imported beef treated with hormones and adopting the Restriction of Hazardous Substances Directive, which requires electronics manufacturers to remove lead, mercury, cadmium, and other hazardous substances from most of their products (Fig. 15).

Figure 15. Label indicating that a product complies with the EU’s Restrictions of Hazardous Substances (RoHS) directive
Source: 2007. Image-Tek/www.image-tk.com.
The Precautionary Principle plays a much weaker role in U.S. environmental regulation, which generally assumes that some level of risk from exposure to contaminants is acceptable and sets controls intended to limit pollution to those levels. Unlike the EU, the United States does not require comprehensive product testing or labeling.
However, some U.S. laws take a precautionary approach in more limited areas. For example, new drugs must be tested before they can be sold, and the National Environmental Policy Act requires environmental impact assessments for any major projects that are federally funded, with an obligation to consider alternatives including no action. Some states and cities have adopted regulations that take a precautionary approach to policies such as using pesticides in schools or funding new technologies. For the most part, though, U.S. environmental laws require some scientific proof of harm as a basis for protective action.
10. Major Laws
Unit 6 // Section 10
The main U.S. law regulating exposure to hazardous materials is the Toxic Substances Control Act (TSCA), passed in 1976. The law authorizes the Environmental Protection Agency to regulate chemical hazards, from warning labels to outright bans. It also allows the EPA to require companies to perform extensive health and safety testing on chemicals before they can be marketed, to maintain detailed records, and to report on how chemicals are used in commerce and industry. The EPA is required to take swift regulatory action if it finds that a chemical is likely to cause cancer, gene mutations, or birth defects.
There are important limitations to the EPA’s ability to regulate the chemical industry under TSCA. First, the burden of proof falls more heavily on the EPA than on chemical manufacturers. The EPA has to have “substantial evidence” of “unreasonable risk” to require testing. Out of the tens of thousands of chemicals in commerce, the EPA has only banned a handful under TSCA. Second, the agency is required to analyze risks and benefits of all less burdensome regulatory alternatives before banning chemicals. The EPA also must evaluate the risk posed by substitute products.
Several other laws regulate specific classes of hazardous substances. The Federal Insecticide, Fungicide, and Rodenticide Act (FIFRA) gives the EPA authority to control pesticides. All pesticides used in the United States must be registered with the EPA after they have been through health and safety testing, and users must take examinations to earn certification as applicators of pesticides. Under the Federal Food, Drug, and Cosmetic Act (FFDCA), the Food and Drug Administration regulates substances such as food additives and colorings, prescription drugs, and cosmetics.
In 1996 the U.S. Congress unanimously passed the Food Quality Protection Act (FQPA), which provides amendments to both FIFRA and FFDCA. Key provisions of FQPA under FFDCA include use of an additional 10-fold uncertainty factor to account for increased susceptibility of children and a requirement for regulators to consider aggregate exposures from multiple pathways (e.g., food, water, yards, pets, etc.) for pesticides with a common mechanism of toxicity (i.e., for organophosphates such as malathion and chlorpyrifos or for pyrethroids such as permethrin and resmethrin) in establishing allowable pesticide residue levels in food.
After three years of consideration, debate, and lobbying, the European Union’s far-reaching regulation on chemicals, REACH, went into effect on June 1, 2007. REACH (Registration, Evaluation, Authorization, and Restriction of Chemicals) is an aggressive law that places priority on protecting health and the environment. The newly established European Chemicals Agency, located in Helsinki, will begin an 11-year process of registering some 30,000 chemical substances in use today. The agency will conduct evaluations, including risk management, to identify gaps in information about hazards, exposure pathways, and health and ecological impacts. REACH is designed to reduce harmful substances in products and the environment and to strongly encourage chemical producers and manufacturing companies to find alternative formulations, processes, and products.
The European market is important to the U.S. chemical industry, which exports some $14 billion worth of products each year. U.S. manufacturers and the federal government opposed many aspects of REACH, but companies doing business with EU countries will have no choice but to comply. The U.S. chemical industry is already providing workshops and other assistance for producers to comply with REACH. Although this process is likely to be long and expensive, it will help to harmonize national regulations for the chemical industry—a positive development, since many hazardous chemicals are produced and distributed worldwide.
11. Further Reading and Footnotes
Unit 6 // Section 11
Further Reading
European Commission , Environment Directorate, “REACH,” http://ec.europa.eu/environment/chemicals/reach/reach_en.htm. An overview of the REACH regulation, including information on benefits and costs.
Dennis Paustenbach, ed., Human and Ecological Risk Assessment: Theory and Practice(New York: Wiley, 2002). A comprehensive textbook, including risks involving air, water, food, occupational exposures, and consumer products.
National Research Council, Science and Judgment in Risk Assessment (Washington, DC: National Academy Press, 1994). An exploration of how risk analysts make assumptions and deal with uncertainty, written to help the EPA make risk assessments more valid and credible by using scientific data more fully and making the limits of knowledge clear.
U.S. National Institutes of Health, National Library of Medicine, “Tox Town,” http://toxtown.nlm.nih.gov/. An animated online guide to connections between chemicals, the environment, and public health, including common exposure locations, non-technical descriptions of chemicals, and links to scientific and health resources.
Footnotes for Unit 6 – Risk, Exposure, and Health
-
- Waltraud Eder, Markus J. Ege, and Erika von Mutius, “The Asthma Epidemic,” New England Journal of Medicine, vol. 355 (2006), pp. 2226–2235.
- Jonathan I. Levy et al., “A Community-Based Participatory Research Study of Multifaceted In-Home Environmental Interventions for Pediatric Asthmatics in Public Housing,” Social Science & Medicine, vol. 63 (2006), pp. 2191–2203.
- U.S. Environmental Protection Agency, Office of Pollution Prevention and Toxics, “New Chemicals and Existing Chemicals,” http://www.epa.gov/oppt/newchems/pubs/newvexist.htm.
- Society for Risk Analysis, “Principles for Risk Analysis,” RISK newsletter, Third Quarter 2001.
- U.S. Environmental Protection Agency, William K. Reilly oral history interview, http://www.epa.gov/history/publications/reilly/20.htm.
- National Research Council, Risk Assessment in the Federal Government: Managing the Process(National Academy Press, 1983).
- U.S. Environmental Protection Agency, Guidelines for Exposure Assessment, FRL-4129-5, 1992, pp. 16–17, http://www.epa.gov/ncea/pdfs/guidline.pdf.
- EPA, Guidelines for Exposure Assessment, FRL-4129-5, 1992, p. 126, http://www.epa.gov/ncea/pdfs/guidline.pdf.
- University of California, Los Angeles, Department of Epidemiology, “Broad Street Pump Outbreak,” http://www.ph.ucla.edu/epi/snow/broadstreetpump.html.
- Austin Bradford Hill, “The Environment and Disease: Association or Causation?” Proceedings of the Royal Society of Medicine, vol. 58 (1965), pp. 295–300, www.edwardtufte.com/tufte/hill.
- National Institutes of Health, Cancer and the Environment, NIH Publication No. 03-2039 (Washington, DC, August 2003), p. 1.
- NIH, Cancer and the Environment, pp. 7–8.
- Nancy Nelson, “The Majority of Cancers Are Linked to the Environment,” BenchMarks, National Cancer Institute, June 17, 2004, http://www.cancer.gov/newscenter/benchmarks-vol4-issue3; Mayo Clinic, “Carcinogens In the Environment: A Major Cause of Cancer?” May 24, 2006.
- U.S. Environmental Protection Agency, Region 2, “EPA Risk Assessments Confirm Exposure to PCBs in River May Increase Cancer Risk, Other Non-Cancer Health Hazards and Threaten Fish and Wildlife,” press release, August 4, 1999.
- U.S. Environmental Protection Agency, Technology Transfer Network, Air Toxics Website, “Risk Assessment for Carcinogens,”http://www.epa.gov/ttn/atw/toxsource/carcinogens.html.
- Pamela R.D. Williams and Dennis J. Paustenbach, “Risk Characterization,” in Dennis J. Paustenbach, ed., Human and Ecological Risk Assessment: Theory and Practice (New York: Wiley, 2002), p. 325.
- http://www.epa.gov/iriswebp/iris/index.html.
- http://www.oehha.ca.gov/prop65/prop65_list/Newlist.html.
- John D. Graham, Director, Office of Information and Regulatory Affairs, Office of Management and Budget, “Valuing Health: An OMB Perspective,” remarks, February 13, 2003, http://www.whitehouse.gov/omb/inforeg/rff_speech_feb13.pdf.
- W. Kip Viscusi and Joseph E. Aldy, “The Value of a Statistical Life: A Critical Review of Market Estimates throughout the World,” Journal of Risk and Uncertainty, Vol. 27, No. 1 (2003), pp. 5–76.