


The Habitable Planet: A Systems Approach to Environmental Science
Earth’s Changing Climate Online Textbook
1. Introduction
Unit 12 // Section 1
For the past 150 years, humans have been performing an unprecedented experiment on Earth’s climate. Human activities, mainly fossil fuel combustion, are increasing concentrations of greenhouse gases (GHGs) in the atmosphere. These gases are trapping infrared radiation emitted from the planet’s surface and warming the Earth. Global average surface temperatures have risen about 0.7°C (1.4°F) since the early 20th century.
Earth’s climate is a complex system that is constantly changing, but the planet is warmer today than it has been for thousands of years, and current atmospheric carbon dioxide (CO2) levels have not been equaled for millions of years. As we will see below, ancient climate records offer some clues about how a warming world may behave. They show that climate shifts may not be slow and steady; rather, temperatures may change by many degrees within a few decades, with drastic impacts on plant and animal life and natural systems. And if CO2 levels continue to rise at projected rates, history suggests that the world will become drastically hotter than it is today, possibly hot enough to melt much of Earth’s existing ice cover. Figure 1 depicts projected surface temperature changes through 2060 as estimated by NASA’s Global Climate Model.

Figure 1. Surface air temperature increase, 1960 to 2060
Source: © National Aeronautics and Space Administration.
Past climate changes were driven by many different types of naturally-occurring events, from variations in Earth’s orbit to volcanic eruptions. Since the start of the industrial age, human activities have become a larger influence on Earth’s climate than other natural factors. High CO2 levels (whether caused by natural phenomena or human activities) are a common factor between many past climate shifts and the warming we see today.
Many aspects of climate change, such as exactly how quickly and steadily it will progress, remain uncertain. However, there is a strong scientific consensus that current trends in GHG emissions will cause substantial warming by the year 2100, and that this warming will have widespread impacts on human life and natural ecosystems. Many impacts have already been observed, including higher global average temperatures, rising sea levels (water expands as it warms), and changes in snow cover and growing seasons in many areas.
A significant level of warming is inevitable due to GHG emissions that have already been released, but we have options to limit the scope of future climate change—most importantly, by reducing fossil fuel consumption (for more details, see Unit 10, “Energy Challenges”). Other important steps to mitigate global warming include reducing the rate of global deforestation to preserve forest carbon sinks and finding ways to capture and sequester carbon dioxide emissions instead of releasing them to the atmosphere. (These responses are discussed in Unit 13, “Looking Forward: Our Global Experiment.”)
2. Tipping Earth's Energy Balance
Unit 12 // Section 2
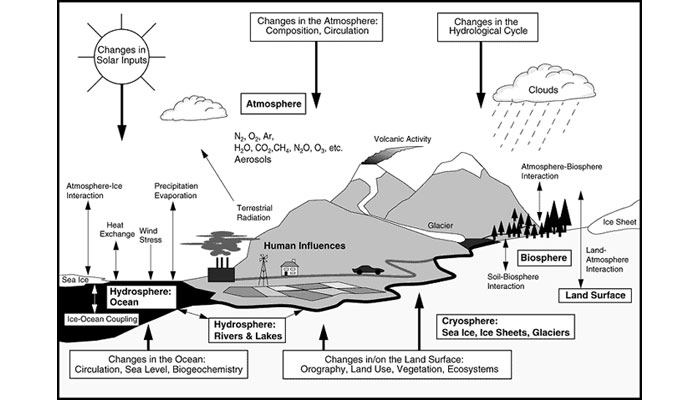
Earth’s climate is a dynamic system that is driven by energy from the sun and constantly impacted by physical, biological, and chemical interactions between the atmosphere, global water supplies, and ecosystems (Fig. 2).

Figure 2. Components and interactions of the global climate system
Source: © Intergovernmental Panel on Climate Change 2001: Synthesis Report, SYR Figure 2-4.
As discussed in Unit 2, “Atmosphere,” energy reaches Earth in the form of solar radiation from the sun. Water vapor, clouds, and other heat-trapping gases create a natural greenhouse effect by holding heat in the atmosphere and preventing its release back to space. In response, the planet’s surface warms, increasing the heat emitted so that the energy released back from Earth into space balances what the Earth receives as visible light from the sun (Fig. 3). Today, with human activities boosting atmospheric GHG concentrations, the atmosphere is retaining an increasing fraction of energy from the sun, raising the earth’s surface temperature. This extra impact from human activities is referred to as anthropogenic climate change.

Figure 3. Earth’s energy balance
Source: Courtesy of Jared T. Williams. © Dan Schrag, Harvard University.
Many GHGs, including water vapor, ozone, CO2, methane (CH4), and nitrous oxide (N2O), are present naturally. Others are synthetic chemicals that are emitted only as a result of human activity, such as chlorofluorocarbons (CFCs), hydrofluorocarbons (HFCs), perfluorocarbons (PFCs), and sulfur hexafluoride (SF6). Important human activities that are raising atmospheric GHG concentrations include:
- fossil fuel combustion (CO2 and small quantities of methane and N2O);
- deforestation (CO2 releases from forest burning, plus lower forest carbon uptake);
- landfills (methane) and wastewater treatment (methane, N2O);
- livestock production (methane, N2O);
- rice cultivation (methane);
- fertilizer use (N2O); and
- industrial processes (HFCs, PFCs, SF6).
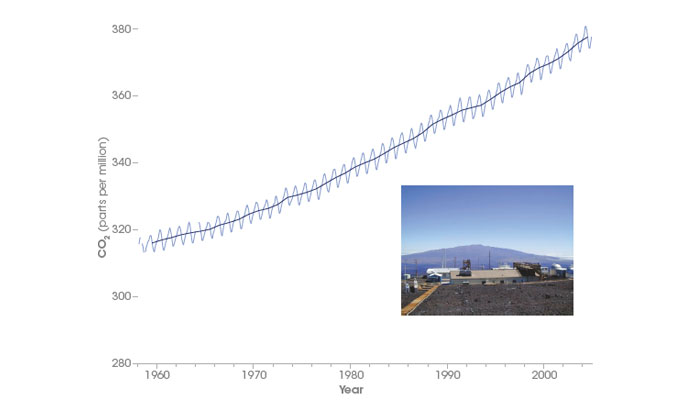
Measuring CO2 levels at Mauna Loa, Hawaii, and other pristine air locations, climate scientist Charles David Keeling traced a steady rise in CO2 concentrations from less than 320 parts per million (ppm) in the late 1950s to 380 ppm in 2005 (Fig. 4). Yearly oscillations in the curve reflect seasonal cycles in the northern hemisphere, which contains most of Earth’s land area. Plants take up CO2 during the growing season in spring and summer and then release it as they decay in fall and winter.

Figure 4. Atmospheric CO2 concentrations, 1958-2005
Source: © 2005. National Aeronautics and Space Administration. Earth Observatory.
Global CO2 concentrations have increased by one-third from their pre-industrial levels, rising from 280 parts per million before the year 1750 to 377 ppm today. Levels of methane and N2O, the most influential GHGs after CO2, also increased sharply in the same time period (see Table 1 below).
If there are so many GHGs, why does CO2 get most of the attention? The answer is a combination of CO2‘s abundance and its residence time in the atmosphere. CO2accounts for about 0.1 percent of the atmosphere, substantially more than all other GHGs except for water vapor, which may comprise up to 7 percent depending on local conditions. However, water vapor levels vary constantly because so much of the Earth’s surface is covered by water and water vapor cycles into and out of the atmosphere very quickly—usually in less than 10 days. Therefore, water vapor can be considered feedback that responds to the levels of other greenhouse gases, rather than an independent climate forcing (footnote 1).
Other GHGs contribute more to global climate change than CO2 on a per-unit basis, although their relative impacts vary with time. The global warming potential (GWP) of a given GHG expresses its estimated climate impact over a specific period of time compared to an equivalent amount by weight of carbon dioxide. For example, the current 100-year GWP for N2O is 296, which indicates that one ton of N2O will have the same global warming effect over 100 years as 296 tons of CO2. Internationally-agreed GWP values are periodically adjusted to reflect current research on GHGs’ behavior and impacts in the atmosphere.
However, CO2 is still the most important greenhouse gas because it is emitted in far larger quantities than other GHGs. Atmospheric concentrations of CO2 are measured in parts per million, compared to parts per billion or per trillion of other gases, and CO2‘s atmospheric lifetime is 50 to 200 years, significantly longer than most GHGs. As illustrated in Table 1, the total extent to which CO2 has raised the global temperature (referred to as radiative forcing and measured in watts per square meter) since 1750 is significantly larger than forcing from other gases.
| Gas | Pre-1750 concentration | Current tropospheric concentration | 100-year GWP | Atmospheric lifetime (years) | Increased radiative forcing (watts/meter2) |
|---|---|---|---|---|---|
| Carbon dioxide | 280 parts per million | 377.3 parts per million | 1 | Variable (up to 200 years) | 1.66 |
| Methane | 688-730 parts per billion | 1,730-1,847 parts per billion | 23 | 12 | 0.5 |
| Nitrous oxide | 270 parts per billion | 318-319 parts per billion | 296 | 114 | 0.16 |
| Tropospheric ozone | 25 | 34 | Not applicable due to short residence time | Hours to days | 0.35 |
| Industrial gases (HFCs, PFCs, halons) | 0 | Up to 545 parts per trillion | Ranges from 140 to 12,000 | Primarily between 5 and 260 years | 0.34 for all halocarbons collectively |
| Sulfur hexafluoride | 0 | 5.22 parts per trillion | 22,200 | 3,200 | 0.002 |
Table 1. Current greenhouse gas concentrations.
Source: T.J. Blasing and Karmen Smith, “Current Greenhouse Gas Concentrations,” Carbon Dioxide Information Analysis Center, Oak Ridge National Laboratory, July 2006
A look at current emissions underlines the importance of CO2. In 2003 developed countries emitted 11.6 billion metric tons of CO2, nearly 83 percent of their total GHG emissions. Developing countries’ reported emissions were smaller in absolute terms, but CO2 accounted for a similarly large share of their total GHG output (footnote 2). In 2004, CO2 accounted for 85 percent of total U.S. GHG emissions, compared to 7.8 percent from methane, 5.4 percent from N2O, and 2 percent from industrial GHGs (footnote 3).
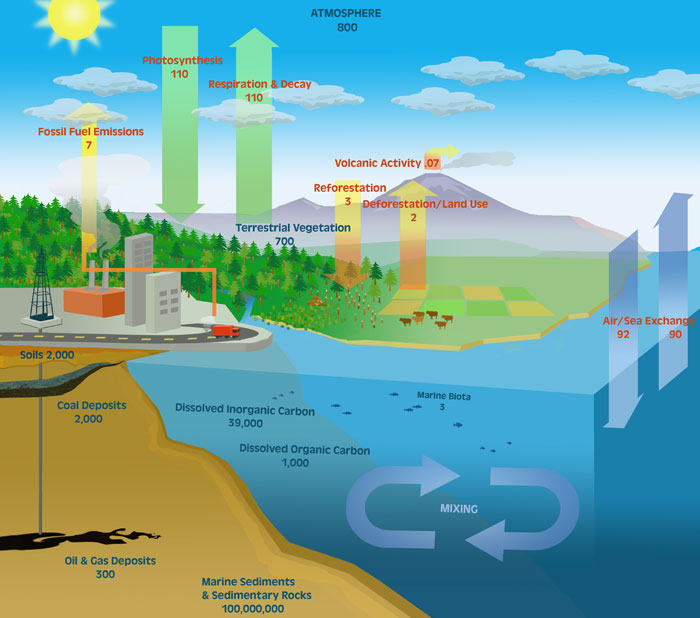
These emissions from human activities may reshape the global carbon cycle. As discussed in Units 2 (“Atmosphere”) and 3 (“Oceans”), roughly 60 percent of CO2emissions from fossil fuel burning remain in the atmosphere, with about half of the remaining 40 percent absorbed by the oceans and half by terrestrial ecosystems. However, there are limits to the amount of anthropogenic carbon that these sinks can take up. Oceans are constrained by the rate of mixing between upper and lower layers, and there are physical bounds on plants’ ability to increase their photosynthesis rates as atmospheric CO2 levels rise and the world warms.
Scientists are still trying to estimate how much carbon these sinks can absorb, but it appears clear that oceans and land sinks cannot be relied on to absorb all of the extra CO2 emissions that are projected in the coming century. This issue is central to projecting future impacts of climate change because emissions that end up in the atmosphere, rather than being absorbed by land or ocean sinks, warm the earth.
3. Climate Change: What the Past Tells Us
Unit 12 // Section 3
Throughout much of its 4.5 billion year history, Earth’s climate has alternated between periods of warmth and relative cold, each lasting for tens to hundreds of millions of years. During the warmest periods, the polar regions of the world were completely free of ice. Earth also has experienced repeated ice ages—periods lasting for millions of years, during which ice sheets advanced and retreated many times over portions of the globe. During the most extreme cold phases, snow and ice covered the entire globe (for more details, see Unit 1, “Many Planets, One Earth”).
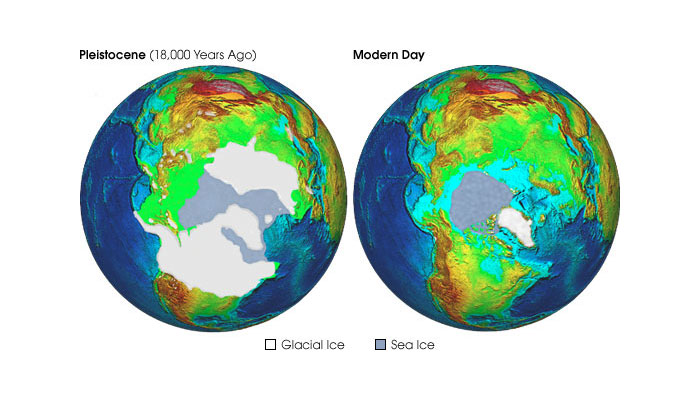
From the perspective of geological time, our planet is currently passing through a relatively cold phase in its history and has been cooling for the past 35 million years, a trend that is only one of many swings between hot and cold states over the last 500 million years. During cold phases glaciers and snow cover have covered much of the mid-latitudes; in warm phases, forests extended all the way to the poles (Fig. 5).

Figure 5. Ice sheet advance during the most recent ice age
Source: Courtesy National Oceanic and Atmospheric Administration Paleoclimatology Program.
Scientists have analyzed paleoclimate records from many regions of the world to document Earth’s climate history. Important sources of information about past climate shifts include:
- Mineral deposits in deep sea beds. Over time, dissolved shells of microscopic marine organisms create layers of chalk and limestone on sea beds. Analyzing the ratio of oxygen-18 (a rare isotope) to oxygen-16 (the common form) indicates whether the shells were formed during glacial periods, when more of the light isotope evaporated and rained down, or during warm periods.
- Pollen grains trapped in terrestrial soils. Scientists use radiocarbon dating to determine what types of plants lived in the sampled region at the time each layer was formed. Changes in vegetation reflect surface temperature changes.
- Chemical variations in coral reefs. Coral reefs grow very slowly over hundreds or thousands of years. Analyzing their chemical composition and determining the time at which variations in corals’ makeup occurred allows scientists to create records of past ocean temperatures and climate cycles.
- Core samples from polar ice fields and high-altitude glaciers. The layers created in ice cores by individual years of snowfall, which alternate with dry-season deposits of pollen and dust, provide physical timelines of glacial cycles. Air bubbles in the ice can be analyzed to measure atmospheric CO2 levels at the time the ice was laid down.
Understanding the geological past is key to today’s climate change research for several reasons. First, as the next sections will show, Earth’s climate history illustrates how changing GHG levels and temperatures in the past shaped climate systems and affected conditions for life. Second, researchers use past records to tune climate models and see whether they are accurately estimating dynamics like temperature increase and climate feedbacks. The more closely a model can replicate past climate conditions, the more accurate its future predictions are likely to be.
4. Past Warming: The Eocene Epoch
Unit 12 // Section 4
Scientists have looked far back in time to find a period when atmospheric GHG concentrations were as high as they could rise in coming decades if current emission trends continue. The Eocene epoch, which lasted from 55 million to 38 million years ago, was the most recent time when scientists think that CO2 was higher than 500 parts per million.
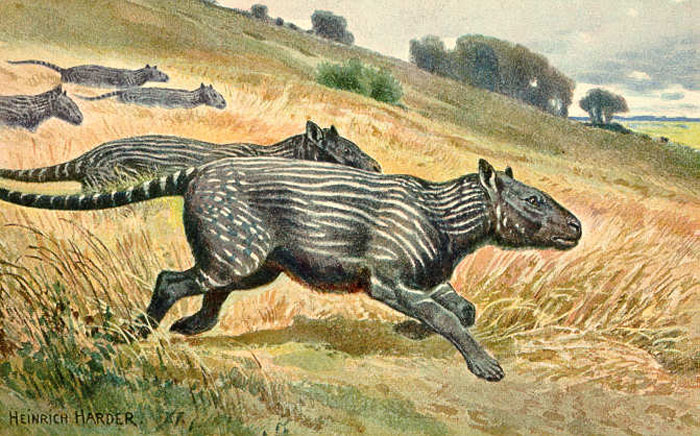
Fossil evidence shows that Earth was far warmer during the Eocene than it is now. Tropical trees grew over much larger ranges to the north and south than they occupy today. Palm trees grew as far north as Wyoming and crocodiles swam in warm ocean water off Greenland. Early forms of modern mammals appeared, including small creatures such as cat-sized horses whose size made them well adapted to a warm climate (Fig. 6). Without ice cover at the poles, sea levels were nearly 100 meters higher than today. The deep ocean, which today is near freezing, warmed to over 12°C.

Figure 6. Phenacodus, a sheep-sized herbivore found in the Eocene era
Source: Courtesy Wikimedia Commons. Public Domain.
Scientists cannot measure CO2 levels during the Eocene—there are no ice cores because there is no ice this old—but from indirect measurements of ocean chemistry, they estimate that atmospheric CO2 levels were three to ten times higher than pre-industrial levels (280 ppm). These concentrations were probably related to a sustained increase in CO2 released from volcanoes over tens of millions of years. Because this climate persisted for tens of millions of years, living species and the climate system had time to adapt to warm, moist conditions. If humans release enough GHGs into the atmosphere to create Eocene-like conditions in the next several centuries, the transition will be much more abrupt, and many living organisms—especially those that thrive in cold conditions—will have trouble surviving the shift.
A troubling lesson from the Eocene is that scientists are unable to simulate Eocene climate conditions using climate models designed for the modern climate. When CO2levels are raised in the computer models to levels appropriate for what scientists think existed during the Eocene, global temperatures rise but high latitude temperatures do not warm as much as what scientists measure, particularly in winter. Some scientists believe that this is because there are unrecognized feedbacks in the climate system involving types of clouds that only form when CO2 levels are very high. If this theory is correct, the future climate could warm even more in response to the anthropogenic release of CO2 than most models predict.
The beginning of the Eocene also hosted a shorter event that may be the best natural analog for what humans are doing to the climate system today. Fifty-five million years ago a rapid warming episode called the Paleocene-Eocene Thermal Maximum (PETM) occurred, in which Earth’s temperature rose by 5 to 6°C on average within 10,000 to 30,000 years. Several explanations have been proposed for this large, abrupt warming, all of which involve a massive infusion of GHGs into the atmosphere, resulting in a trebling or perhaps a quadrupling of CO2 concentrations, not unlike what is predicted for CO2 levels by 2100 (footnote 4).
5. Global Cooling: The Pleistocene Epoch
Unit 12 // Section 5
During the Pleistocene epoch, which began about 2 million years ago, Earth’s average temperature has always been cold enough to maintain ice at high latitudes. But Pleistocene climate has not been constant: ice coverage has fluctuated dramatically, with continental ice sheets advancing and retreating over large parts of North America and Europe. These peak glacial periods are often referred to as “Ice Ages” or “Glacial Maxima.” During the Pleistocene, Earth has experienced more than 30 swings between prolonged glacial periods and brief warmer interglacial phases like the one we live in today.
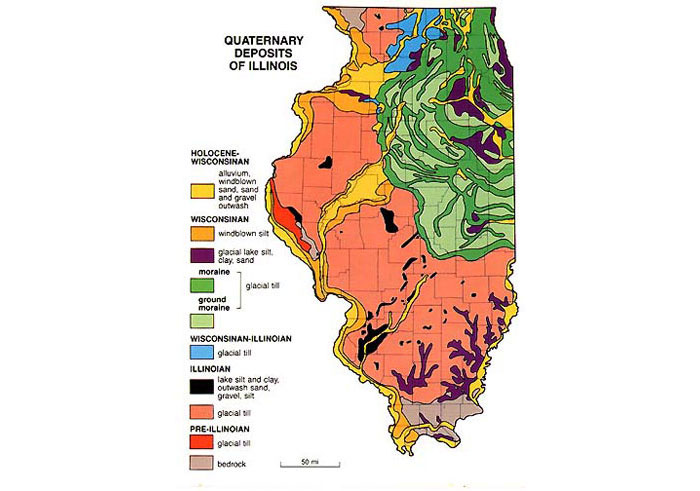
Glacial advances and retreats shaped Earth’s topography, soils, flora, and fauna (Fig. 7). During glaciation events, huge volumes of water were trapped in continental ice sheets, lowering sea levels as much as 130 meters and exposing land between islands and across continents. These swings often changed ocean circulation patterns. During the most extreme cold phases, ice covered up to 30 percent of the Earth’s surface.

Figure 7. Pleistocene glacial deposits in Illinois
Source: Courtesy Illinois State Geological Survey.
As glaciers advanced and retreated at high latitudes, ecosystems at lower latitudes evolved to adapt to prevailing climate conditions. In North America, just south of the advancing glaciers, a unique type of grass steppe supported distinctive cold-adapted fauna dominated by large mammals such as the mammoth, woolly rhinoceros, and dire wolf.
Why did Pleistocene temperatures swing back and forth so dramatically? Scientists point to a combination of factors. One main cause is variations in Earth’s orbit around the sun. These variations, which involve the tilt of the Earth’s pole of rotation and the ellipticity of the Earth’s orbit, have regular timescales of 23,000, 41,000, and 100,000 years and cause small changes in the distribution of solar radiation received on the Earth (footnote 5). The possibility that these subtle variations could drive changes in climate was first proposed by Scottish scientist James Croll in the 1860s. In the 1930s, Serbian astronomer Milutin Milankovitch developed this idea further. Milankovitch theorized that variations in summer temperature at high latitudes were what drove ice ages—specifically, that cool summers kept snow from melting and allowed glaciers to grow.
However, changes in summer temperature due to orbital variations are too small to cause large climate changes by themselves. Positive feedbacks are required to amplify the small changes in solar radiation. The two principal feedbacks are changes in Earth’s albedo (the amount of light reflected from the Earth’s surface) from snow and ice buildup and in the amount of CO2 in the atmosphere.
Ice core samples from the Vostok station and the European Project for Ice Coring in Antarctica (EPICA) document that CO2 levels have varied over glacial cycles. From bubbles trapped in the ice, scientists can measure past concentrations of atmospheric CO2. The ice’s chemical composition can also be used to measure past surface temperatures. Taken together, these records show that temperature fluctuations through glacial cycles over the past 650,000 years have been accompanied by shifts in atmospheric CO2. GHG concentrations are high during warm interglacial periods and are low during glacial maxima. The ice cores also show that atmospheric CO2concentrations never exceeded 300 parts per million—and therefore that today’s concentration is far higher than what has existed for the last 650,000 years (Fig. 8).

Figure 8. Vostok ice-core CO2 record
Source: © Jean-Marc Barnola et al., Oak Ridge National Laboratory.
One important lesson from ice cores is that climate change is not always slow or steady. Records from Greenland show that throughout the last glacial period, from about 60,000 to 20,000 years ago, abrupt warming and cooling swings called Dansgaard-Oeschger, or D-O, events took place in the North Atlantic. In each cycle temperatures on ice sheets gradually cooled, then abruptly warmed by as much as 20°C, sometimes within less than a decade. Temperatures would then decline gradually over a few hundred to a few thousand years before abruptly cooling back to full glacial conditions. Similar climate fluctuations have been identified in paleoclimate records from as far away as China.
These sharp flips in the climate system have yet to be explained. Possible causes include changes in solar output or in sea ice levels around Greenland. But they are powerful evidence that when the climate system reaches certain thresholds, it can jump very quickly from one state to another. At the end of the Younger Dryas—a near-glacial phase that started about 12,800 years ago and lasted for about 1,200 years—annual mean temperatures increased by as much as 10°C in ten years (footnote 6).
6. Present Warming and the Role of CO2
Unit 12 // Section 6
There is clear evidence from many sources that the planet is heating up today and that the pace of warming may be increasing. Earth has been in a relatively warm interglacial phase, called the Holocene Period, since the last ice age ended roughly 10,000 years ago. Over the past thousand years average global temperatures have varied by less than one degree—even during the so-called “Little Ice Age,” a cool phase from the mid-fourteenth through the mid-nineteenth centuries, during which Europe and North America experienced bitterly cold winters and widespread crop failures.
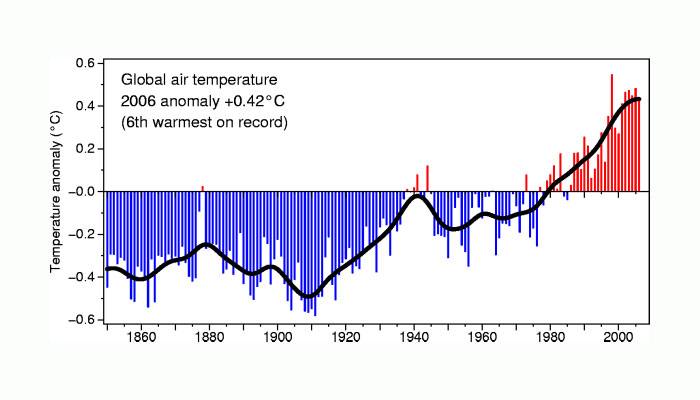
Over the past 150 years, however, global average surface temperatures have risen, increasing by 0.6°C +/- 0.2°C during the 20th century. This increase is unusual because of its magnitude and the rate at which it has taken place. Nearly every region of the globe has experienced some degree of warming in recent decades, with the largest effects at high latitudes in the Northern Hemisphere. In Alaska, for example, temperatures have risen three times faster than the global average over the past 30 years. The 1990s were the warmest decade of the 20th century, with 1998 the hottest year since instrumental record-keeping began a century ago, and the ten warmest years on record have all occurred since 1990 (Fig. 9).

Figure 9. Global temperature record
Source: Courtesy Phil Jones. © Climactic Research Unit, University of East Anglia and the U.K. Met. Office Hadley Centre.
As temperatures rise, snow cover, sea ice, and mountain glaciers are melting. One piece of evidence for a warming world is the fact that tropical glaciers are melting around the globe. Temperatures at high altitudes near the equator are very stable and do not usually fluctuate much between summer and winter, so the fact that glaciers are retreating in areas like Tanzania, Peru, Bolivia, and Tibet indicates that temperatures are rising worldwide. Ice core samples from these glaciers show that this level of melting has not occurred for thousands of years and therefore is not part of any natural cycle of climate variability. Paleoclimatologist Lonnie Thompson of Ohio State University, who has studied tropical glaciers in South America, Asia, and Africa, predicts that glaciers will disappear from Kilimanjaro in Tanzania and Quelccaya in Peru by 2020.
“The fact that every tropical glacier is retreating is our warning that the system is changing.”
Lonnie Thompson, Ohio State University
Rising global temperatures are raising sea levels due to melting ice and thermal expansion of warming ocean waters. Global average sea levels rose between 0.12 and 0.22 meters during the 20th century, and global ocean heat content increased. Scientists also believe that rising temperatures are altering precipitation patterns in many parts of the Northern Hemisphere (footnote 7).
Because the climate system involves complex interactions between oceans, ecosystems, and the atmosphere, scientists have been working for several decades to develop and refine General Circulation Models (also known as Global Climate Models), or GCMs, highly detailed models typically run on supercomputers that simulate how changes in specific parameters alter larger climate patterns. The largest and most complex type of GCMs are coupled atmosphere-ocean models, which link together three-dimensional models of the atmosphere and the ocean to study how these systems impact each other. Organizations operating GCMs include the National Aeronautic and Space Administration (NASA)’s Goddard Institute for Space Studies and the United Kingdom’s Hadley Centre for Climate Prediction and Research (Fig. 10).

Figure 10. Hadley Centre GCM projection
Source: © Crown copyright 2006, data supplied by the Met Office.
Source: © Crown copyright 2006, data supplied by the Met Office.
Researchers constantly refine GCMs as they learn more about specific components that feed into the models, such as conditions under which clouds form or how various types of aerosols scatter light. However, predictions of future climate change by existing models have a high degree of uncertainty because no scientists have ever observed atmospheric CO2 concentrations at today’s levels.
Modeling climate trends is complicated because the climate system contains numerous feedbacks that can either magnify or constrain trends. For example, frozen tundra contains ancient carbon and methane deposits; warmer temperatures may create positive feedback by melting frozen ground and releasing CO2 and methane, which cause further warming. Conversely, rising temperatures that increase cloud formation and thereby reduce the amount of incoming solar radiation represent negative feedback. One source of uncertainty in climate modeling is the possibility that the climate system may contain feedbacks that have not yet been observed and therefore are not represented in existing GCMs.
Scientific evidence, including modeling results, indicates that rising atmospheric concentrations of CO2 and other GHGs from human activity are driving the current warming trend. As the previous sections showed, prior to the industrial era atmospheric CO2 concentrations had not risen above 300 parts per million for several hundred thousand years. But since the mid-18th century, CO2 levels have risen steadily.
In 2007 the Intergovernmental Panel on Climate Change (IPCC), an international organization of climate experts created in 1988 to assess evidence of climate change and make recommendations to national governments, reported that CO2 levels had increased from about 280 ppm before the industrial era to 379 ppm in 2005. The present CO2 concentration is higher than any level over at least the past 420,000 years and is likely the highest level in the past 20 million years. During the same time span, atmospheric methane concentrations rose from 715 parts per billion (ppb) to 1,774 ppb and N2O concentrations increased from 270 ppb to 319 ppb.a
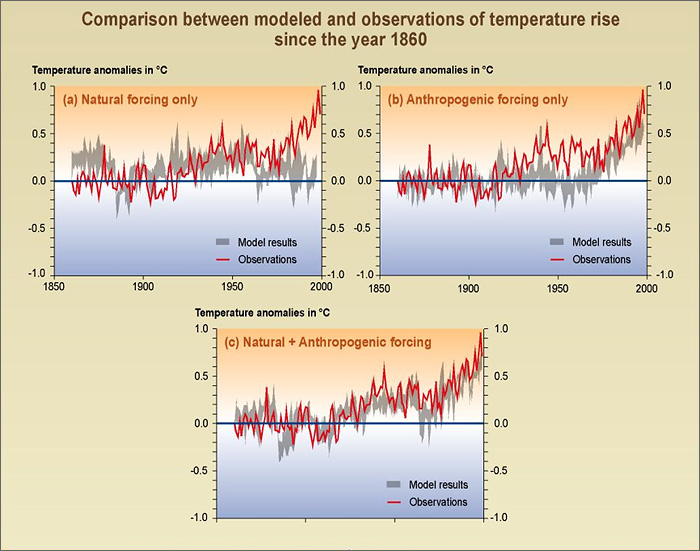
Do these rising GHG concentrations explain the unprecedented warming that has taken place over the past century? To answer this question scientists have used climate models to simulate climate responses to natural and anthropogenic forcings. The best matches between predicted and observed temperature trends occur when these studies simulate both natural forcings (such as variations in solar radiation levels and volcanic eruptions) and anthropogenic forcings (GHG and aerosol emissions) (Fig. 11). Taking these findings and the strength of various forcings into account, the IPCC stated in 2007 that Earth’s climate was unequivocally warming and that most of the warming observed since the mid-20th century was “very likely” (meaning a probability of more than 90 percent) due to the observed increase in anthropogenic GHG emissions (footnote 9).

Figure 11. Comparison between modeled and observations of temperature rise since the year 1860
Source: © Intergovernmental Panel on Climate Change, Third Assessment Report, 2001. Working Group 1: The Scientific Basis, Figure 1.1.
Aerosol pollutants complicate climate analyses because they make both positive and negative contributions to climate forcing. As discussed in Unit 11, “Atmospheric Pollution,” some aerosols such as sulfates and organic carbon reflect solar energy back from the atmosphere into space, causing negative forcing. Others, like black carbon, absorb energy and warm the atmosphere. Aerosols also impact climate indirectly by changing the properties of clouds—for example, serving as nuclei for condensation of cloud particles or making clouds more reflective.
Researchers had trouble explaining why global temperatures cooled for several decades in the mid-20th century until positive and negative forcings from aerosols were integrated into climate models. These calculations and observation of natural events showed that aerosols do offset some fraction of GHG emissions. For example, the 1991 eruption of Mount Pinatubo in the Philippines, which injected 20 million tons of SO2 into the stratosphere, reduced Earth’s average surface temperature by up to 1.3°F annually for the following three years (footnote 10).
But cooling from aerosols is temporary because they have short atmospheric residence times. Moreover, aerosol concentrations vary widely by region and sulfate emissions are being reduced in most industrialized countries to address air pollution. Although many questions remain to be answered about how various aerosols are formed and contribute to radiative forcing, they cannot be relied on to offset CO2 emissions in the future.
7. Observed Impacts of Climate Change
Unit 12 // Section 7
Human-induced climate change has already had many impacts. As noted above, global average surface temperatures rose by 0.6°C +/- 0.2°C and sea levels rose by 0.12 to 0.22 meters during the 20th century. Other observed changes in Earth systems that are consistent with anthropogenic climate change include:
- Decreases by about two weeks in the duration of ice cover on rivers and lakes in the mid- and high latitudes of the Northern Hemisphere over the 20th century;
- Decreases by 10 percent in the area of snow cover since satellite images became available in the 1960s;
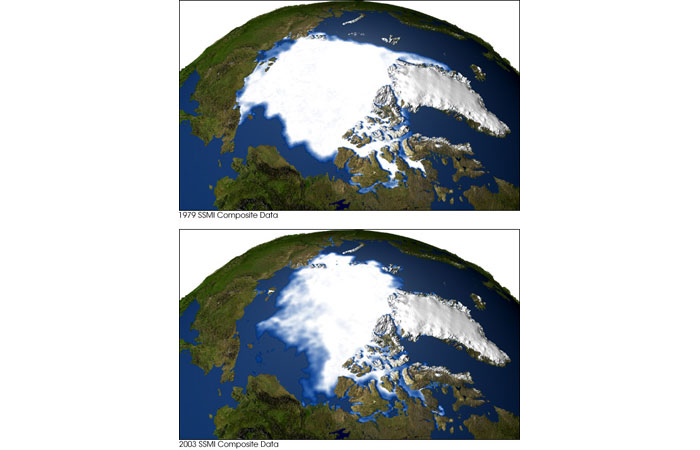
- Thinning by 40 percent of Arctic sea ice in late summer to early autumn in recent decades, and decrease by 10 to 15 percent in extent in spring and summer since the 1950s (Fig. 12);
- Widespread retreat of non-polar glaciers;
- Increases by about 1 to 4 days per decade in growing seasons in the Northern Hemisphere, especially at higher latitudes, during the last 40 years; and
- Thawing, warming, and degrading of permafrost in some regions (footnote 11)

Figure 12. Arctic sea ice coverage, 1979 and 2003
Source: ©National Aeronautic and Space Administration.
The Earth is not warming uniformly. Notably, climate change is expected to affect the polar regions more severely. Melting snow and ice expose darker land and ocean surfaces to the sun, and retreating sea ice increases the release of solar heat from oceans to the atmosphere in winter. Trends have been mixed in Antarctica, but the Arctic is warming nearly twice as rapidly as the rest of the world; winter temperatures in Alaska and western Canada have risen by up to 3–4°C in the past 50 years, and Arctic precipitation has increased by about 8 percent over the past century (mostly as rain) (footnote 12).
Observed climate change impacts are already affecting Earth’s physical and biological systems. Many natural ecosystems are vulnerable to climate change impacts, especially systems that grow and adapt slowly. For example, coral reefs are under serious stress from rapid ocean warming. Recent coral bleaching events in the Caribbean and Pacific oceans have been correlated with rising sea surface temperatures over the past century (footnote 13). Some natural systems are more mobile. For example, tree species in New England such as hemlock, white pine, maple, beech, and hickory have migrated hundreds of meters per year in response to warming and cooling phases over the past 8,000 years (footnote 14). But species may not survive simply by changing their ranges if other important factors such as soil conditions are unsuitable in their new locations.
Insects, plants, and animals may respond to climate change in many ways, including shifts in range, alterations of their hibernation, migrating, or breeding cycles, and changes in physical structure and behavior as temperature and moisture conditions alter their immediate environments. A recent review of more than 40 studies that assessed the impacts of climate change on U.S. ecosystems found broad impacts on plants, animals, and natural ecosystem processes. Important trends included:
- Earlier spring events (emergence from hibernation, plant blooming, and the onset of bird and amphibian breeding cycles);
- Insect, bird, and mammal range shifts northward and to higher elevations; and
- Changes in the composition of local plant and animal communities favoring species that are better adapted to warming conditions (higher temperatures, more available water, and higher CO2 levels).
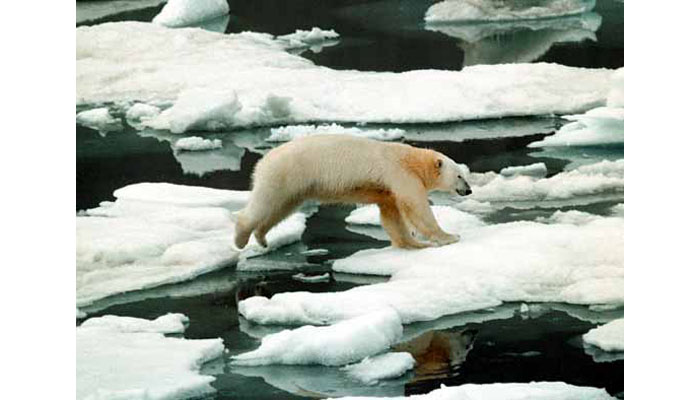
Because many natural ecosystems are smaller, more isolated, and less genetically diverse today than in the past, it may be increasingly difficult for them to adapt to climate change by migrating or evolving, the review’s authors concluded (footnote 15). This is especially true if climate shifts happen abruptly so that species have less response time, or if species are adapted to unique environments (Fig. 13).

Figure 13. Polar bear hunting on Arctic sea ice
Source: © Greenpeace/Beltra.
8. Other Potential Near-Term Impacts
Unit 12 // Section 8
In its 2007 assessment report the IPCC projected that global average surface temperatures for the years 2090 to 2099 will rise by 1.1 to 6.4°C over values in 2001 to 2010. The greatest temperature increases will occur over land and at high northern latitudes, with less warming over the southern oceans and the North Atlantic (footnote 16).
This rate of warming, driven primarily by fossil fuel consumption, would be much higher than the changes that were observed in the 20th century and probably unprecedented over at least the past 10,000 years. Based on projections like this, along with field studies of current impacts, scientists forecast many significant effects from global climate change in the next several decades, although much uncertainty remains about where these impacts will be felt worldwide and how severe they will be.
Climate change is likely to alter hydrologic cycles and weather patterns in many ways, such as shifting storm tracks, increasing or reducing annual rainfall from region to region, and producing more extreme weather events such as storms and droughts (Fig. 14). While precipitation trends vary widely over time and area, total precipitation increased during the 20th century over land in high-latitude regions of the Northern Hemisphere and decreased in tropical and subtropical regions (footnote 17).

Figure 14. Flooding in New Orleans after Hurricane Katrina, 2005
Source: © National Oceanic and Atmospheric Administration.
Rising temperatures and changing hydrological cycles are likely to have many impacts, although it is hard to predict changes in specific regions—some areas will become wetter and some dryer. Storm tracks may shift, causing accustomed weather patterns to change. These changes may upset natural ecosystems, potentially leading to species losses. They also could reduce agricultural productivity if new temperature and precipitation patterns are less than optimal for major farmed crops (for example, if rainfall drops in the U.S. corn belt). Some plant species may migrate north to more suitable ecosystems—for example, a growing fraction of the sugar maple industry in the northeastern United States is already moving into Canada—but soils and other conditions may not be as appropriate in these new zones.
Some natural systems could benefit from climate change at the same time that others are harmed. Crop yields could increase in mid-latitude regions where temperatures rise moderately, and winter conditions may become more moderate in middle and high latitudes. A few observers argue that rising CO2 levels will produce a beneficial global “greening,” but climate change is unlikely to increase overall global productivity. Research by Stanford University ecologist Chris Field indicates that elevated CO2 prevents plants from increasing their growth rates, perhaps by limiting their ability to utilize other components that are essential for growth such as nutrients. This finding suggests that terrestrial ecosystems may take up less carbon in a warming world than they do today, not more.
Undesirable species may also benefit from climate change. Rising temperatures promote the spread of mosquitoes and other infectious disease carriers that flourish in warmer environments or are typically limited by cold winters (Fig. 15). Extreme weather events can create conditions that are favorable for disease outbreaks, such as loss of clean drinking water and sanitation systems. Some vectors are likely to threaten human health, while others can damage forests and agricultural crops.

Figure 15. Infectious diseases affected by climate change
Source: © Climate Change 1995, Impacts, adaptations and mitigation of climate change: scientific-technical analyses, working group 2 to the second assessment report of the IPCC, UNEP, and WMO, Cambridge Press University, 1996.
Melting of polar ice caps and glaciers is already widespread and is expected to continue throughout this century. Since the late 1970s Arctic sea ice has decreased by about 20 percent; in the past several years, this ice cover has begun to melt in winter as well as in summer, and some experts predict that the Arctic could be ice-free by 2100. Ice caps and glaciers contain some 30 million cubic kilometers of water, equal to about 2 percent of the volume of the oceans. Further melting of sea ice will drive the continued sea-level rise and increase flooding and storm surge levels in coastal regions.
Warmer tropical sea surface temperatures are already increasing the intensity of hurricanes, and this trend may accelerate as ocean temperatures rise (footnote 18). Stronger storms coupled with rising sea levels are expected to increase flooding damage in coastal areas worldwide. Some scientists predict that extreme weather events, such as storms and droughts, may become more pronounced, although this view is controversial. In general, however, shifting atmospheric circulation patterns may deliver “surprises” as weather patterns migrate and people experience types of weather that fall outside their range of experience, such as flooding at a level formerly experienced only every 50 or 100 years.
Human societies may already be suffering harmful impacts from global climate change, although it is important to distinguish climate influences from other socioeconomic factors. For example, financial damages from storms in the United States have risen sharply over the past several decades, a trend that reflects both intensive development in coastal areas and the impact of severe tropical storms in those densely populated regions. Human communities clearly are vulnerable to climate change, especially societies that are heavily dependent on natural resources such as forests, agriculture, and fishing; low-lying regions subject to flooding; water-scarce areas in the subtropics; and communities in areas that are subject to extreme events such as heat episodes and droughts. In general, developed nations have more adaptive capacity than developing countries because wealthier countries have greater economic and technical resources and are less dependent on natural resources for income.
And more drastic changes may lie in store. As discussed above, climate records show that the climate can swing suddenly from one state to another within periods as short as a decade. A 2002 report by the National Research Council warned that as atmospheric GHG concentrations rise, the climate system could reach thresholds that trigger sudden drastic shifts, such as changes in ocean currents or a major increase in floods or hurricanes (footnote 19).
“Just as the slowly increasing pressure of a finger eventually flips a switch and turns on a light, the slow effects of drifting continents or wobbling orbits or changing atmospheric composition may ‘switch’ the climate to a new state.”
Richard B. Alley, Chair
Committee on Abrupt Climate Change,
National Research Council
How much the planet will warm in the next century, and what kind of impacts will result, depends on how high CO2 concentrations rise. In turn, this depends largely on human choices about fossil fuel consumption. Because fossil fuel accounts for 80 percent of global energy use, CO2 levels will continue to rise for at least the next 30 or 40 years, so additional impacts are certain to be felt. This means that it is essential both to mitigate global climate change by reducing CO2 emissions and to adapt to the changes that have already been set in motion. (For more on options for mitigating and adapting to climate change, see Unit 13, “Looking Forward: Our Global Experiment.”)
9. Major Laws and Treaties
Unit 12 // Section 9
Science plays a central role in international negotiations to address global climate change. In 1988, the World Meteorological Organization and the United Nations Environment Programme established the Intergovernmental Panel on Climate Change (IPCC), an organization composed of official government representatives that is charged with assessing scientific, technical, and socio-economic information relevant to understanding climate change risks, potential impacts, and mitigation and adaptation options (footnote 20). The IPCC meets regularly to review and assess current scientific literature and issues “assessment reports” at approximately five-year intervals (most recently in 2007). IPCC reports are adopted by consensus and represent a broad cross-section of opinion from many nations and disciplines regarding current understanding of global climate change science. The panel’s recommendations are not binding on governments, but its models and estimates are important starting points for international climate change negotiations.
The most broadly-supported international agreement on climate change, the United Nations Framework Convention on Climate Change (FCCC), was opened for signature in 1992 and entered into force in 1994 (footnote 21). To date it has been ratified by 189 countries, including the United States. FCCC signatories pledge to work toward stabilizing atmospheric GHG concentrations “at a level that would prevent dangerous anthropogenic interference with the climate system,” but the Convention does not define that level. As a result, it has not been a significant curb on GHG emissions, although it creates a system for nations to report emissions and share other relevant information and for developed countries to provide financial and technical support for climate change initiatives to developing countries.
Recognizing that the FCCC commitments were not sufficient to prevent serious climate change, governments negotiated the Kyoto Protocol, which commits industrialized countries to binding GHG emission reductions of at least 5 percent below their 1990 levels by the period of 2008–2012 (footnote 22). The Protocol focuses on developed countries in reflection of the fact that they are the source of most GHGs emitted to date, although it allows developed countries to fulfill their reduction commitments partially through projects to reduce or avoid GHG reductions in developing countries.
The Kyoto Protocol entered into force in 2005 and has been ratified to date by 163 countries, representing 61.6 percent of developed countries’ GHG emissions. The United States signed the Protocol but has not ratified it. President George W. Bush argued that the economic impact of its assigned reductions (7 percent below 1990 levels) would be too severe and instead emphasized voluntary domestic reduction commitments.
For all of the controversy that it has generated, the Kyoto Protocol alone will not reduce the threat of major climate change because it covers only 40 percent of global GHG emissions without U.S. participation, does not require emission reductions from rapidly developing countries, like India and China, that are major fossil fuel consumers, and only covers emission through the year 2012. No single option has emerged yet as a follow-on, but analysts widely agree that the next phase of global action against climate change will have to take a longer-term approach, address the costs of reducing GHG emissions, and find ways to help developing countries reap the benefits of economic growth on a lower-carbon pathway than that which industrialized countries followed over the past 150 years. Continually improving our scientific understanding of climate change and its impacts will help nations to identify options for action.
10. Further Reading and Footnotes
Unit 12 // Section 10
Further Reading
Center for Health and the Global Environment, Harvard Medical School, Climate Change Futures: Health, Ecological, and Economic Dimensions (Boston, MA: Harvard Medical School, November 2005).
“The Discovery of Global Warming,” (http://www.aip.org/history/climate). Created by Spencer Weart, author of the book of the same title, this site includes detailed essays on the history of climate change science, case studies, and links to relevant scientific and historical publications.
James E. Hansen, “Can We Still Avoid Dangerous Human-Made Climate Change?” February 10, 2006, http://www.columbia.edu/~jeh1/newschool_text_and_slides.pdf. In this speech and accompanying slides, a leading U.S. climate scientist makes the case for action to slow global climate change.
Footnotes
- Water vapor contributes to climate change through an important positive feedback loop: as the atmosphere warms, evaporation from Earth’s surface increases and the atmosphere becomes able to hold more water vapor, which in turn traps more thermal energy and warms the atmosphere further. It also can cause negative feedback when water in the atmosphere condenses into clouds that reflect solar radiation back into space, reducing the total amount of energy that reaches Earth. For more details, see National Oceanic and Atmospheric Administration, “Greenhouse Gases: Frequently Asked Questions,”
- Key GHG Data: Greenhouse Gas Emissions Data for 1990–2003 Submitted To the United Nations Framework Convention on Climate Change (Bonn: United Nations Framework Convention on Climate Change, November 2005), pp. 16, 28.
- U.S. Environmental Protection Agency, “The U.S. Inventory of Greenhouse Gas Emissions and Sinks: Fast Facts,” April 2006.
- John A. Higgins and Daniel P. Schrag, “Beyond Methane: Towards a Theory for the Paleocene-Eocene Thermal Maximum,” Earth and Planetary Science Letters, vol. 245 (2006), pp. 523–537.
- National Oceanographic and Atmospheric Administration, Paleoclimatology Branch, “Astronomical Theory of Climate Change,” http://www.ncdc.noaa.gov/paleo/milankovitch.html; Spencer R. Weart, The Discovery of Global Warming (Cambridge, MA: Harvard University Press, 2003), pp. 74–77.
- “Abrupt Climate Change,” Lamont-Doherty Earth Observatory, Columbia University.
- Intergovernmental Panel on Climate Change, Climate Change 2007: The Scientific Basis, Summary for Policymakers (Cambridge, UK: Cambridge University Press, 2007), pp. 4–6.
- Ibid., pp. 2–3.
- Ibid., p. 8.
- U.S. Geological Survey, “Impacts of Volcanic Gases on Climate, The Environment, and People,” May 1997, http://pubs.usgs.gov/of/1997/of97-262/of97-262.html.
- IPCC, Climate Change 2001: Synthesis Reports, Summary for Policymakers (Cambridge, UK: Cambridge University Press, 2001), p. 6.
- ACIA, Impacts of a Warming Arctic: Arctic Climate Impact Assessment (Cambridge, UK: Cambridge University Press, 2004), p. 12.
- J.E. Weddell, ed., The State of Coral Reef Ecosystems of the United States and Pacific Freely Associated States, 2005, NOAA Technical Memorandum NOS NCCOS 11 (Silver Spring, MD: NOAA/NCCOS Center for Coastal Monitoring and Assessment’s Biogeography Team, 2005), pp. 13–15.
- David R. Foster and John D. Aber, eds., Forests in Time: The Environmental Consequences of 1,000 Years of Change in New England (New Haven: Yale University Press, 2004), pp. 45–46.
- Camille Parmesan and Hector Galbraith, Observed Impacts of Global Climate Change in the U.S. (Arlington, VA: Pew Center on Global Climate Change, 2004), http://www.pewclimate.org/global-warming-in-depth/all_reports/observedimpacts/index.cfm.
- IPCC, Climate Change 2007: The Scientific Basis, p. 749.
- United Nations Environment Programme, “Observed Climate Trends.”
- Kerry Emanuel, “Increasing Destructiveness of Tropical Cyclones Over the Past 30 Years,” Nature, vol. 436, August 4, 2005, pp. 686–88, and “Anthropogenic Effects on Tropical Cyclone Activity,” http://wind.mit.edu/~emanuel/anthro2.htm.
- National Research Council, Abrupt Climate Change: Inevitable Surprises (Washington, DC: National Academy Press, 2002).
- http://www.ipcc.ch/.
- http://unfccc.int/essential_background/convention/items/2627.php.
- http://unfccc.int/essential_background/kyoto_protocol/items/2830.php.