The Habitable Planet: A Systems Approach to Environmental Science
Earth’s Changing Climate
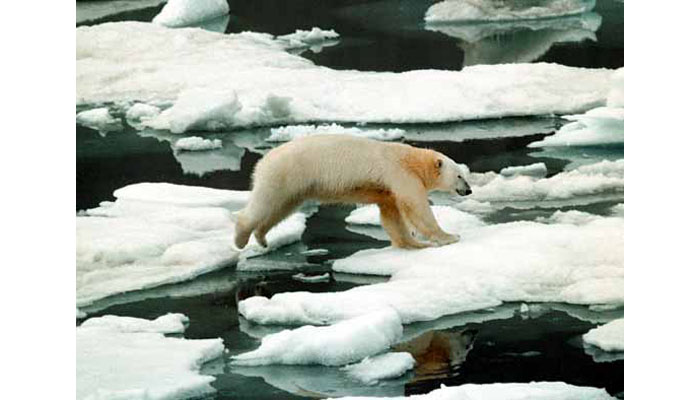
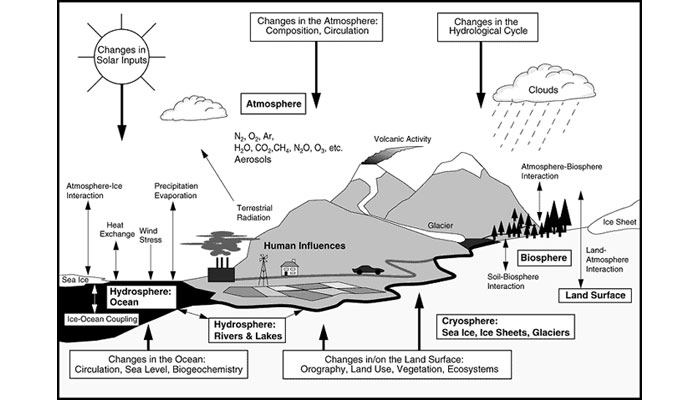
Earth's climate is a sensitive system that is subject to dramatic shifts over varying time scales. Today human activities are altering the climate system by increasing concentrations of heat-trapping greenhouse gases in the atmosphere, which raises global temperatures. In this unit, examine the science behind global climate change and explore its potential impacts on natural ecosystems and human societies.

Interactive Labs
In today’s world, with populations and economies booming, the demand for energy is rising. A portfolio of different energy sources is used to meet this demand. Since there is no perfectly clean, safe, and inexpensive source of energy, the composition of this portfolio involves tradeoffs of safety, cost, and-of increasing concern-emissions of greenhouse gases such as CO2 (if you haven’t done the Carbon Cycle lab yet, we recommend you start there). In this lab, your challenge is to try to meet the world’s projected energy demand by choosing from the available energy sources while keeping atmospheric CO2under control and avoiding the particular limits and pitfalls associated with each energy source.
Glossary
Unit 12: Earth’s Changing Climate // Glossary
aerosols
Liquid or solid particles that are suspended in air or a gas. Also referred to as particulate matter.
albedo
The fraction of electromagnetic radiation reflected after striking a surface.
anthropogenic
Describing effects or processes that are derived from human activities, as opposed to effects or processes that occur in the natural environment without human influences.
coral bleaching
Refers to the loss of color of corals due to stress-induced expulsion of symbiotic, unicellular algae called zooxanthellae that live within their tissues. Stress can be induced by: (1) increased water temperatures (often attributed to global warming), (2) starvation caused by a decline in zooplankton levels as a result of overfishing, (3) solar irradiance (photosynthetically active radiation and ultraviolet band light), (4) changes in water chemistry, (5) silt runoff, or (6) pathogen infections.
deforestation
Removal of trees and other vegetation on a large scale, usually to expand agricultural or grazing lands.
United Nations Framework Convention on Climate Change
A treaty signed by nations at the Earth Summit in 1992 to stabilize and reduce greenhouse gas emissions. In 1997 the Kyoto Protocol, an agreement among 150 nations, was added, setting specific reduction levels.
global warming potential
A measure of how much a given mass of greenhouse gas is estimated to contribute to global warming. Compares the gas in question to that of the same mass of carbon dioxide.
Intergovernmental Panel on Climate Change (IPCC)
Established in 1988 by two United Nations organizations to assess the risk of human-induced climate change.
Kyoto Protocol
An amendment to the international treaty on climate change, assigning mandatory targets for the reduction of greenhouse gas emissions to signatory nations.
paleoclimate
Referring to past climates of the Earth.
permafrost
Soil that stays in a frozen state for more than two years in a row.
radiocarbon dating
A radiometric dating method that uses the naturally occurring isotope carbon-14 to determine the age of carbonaceous materials up to about 60,000 years.
residence time
A broadly useful concept that expresses how fast something moves through a system in equilibrium; the average time a substance spends within a specified region of space, such as a reservoir. For example, the residence time of water stored in deep groundwater, as part of the water cycle, is about 10.000 years.
sinks
Habitats that serve to trap or otherwise remove chemicals such as plant nutrients, organic pollutants, or metal ions through natural processes.
Beyond the Habitable Planet: How the Sun Influences the Earth
by Leonard Strachan
Studies of Past Climate
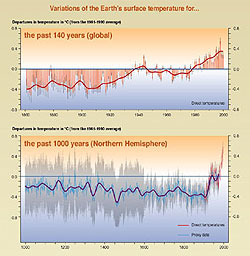
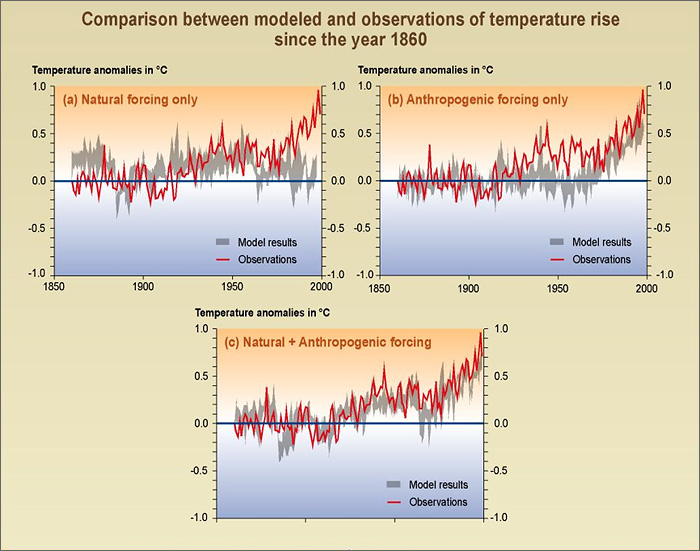
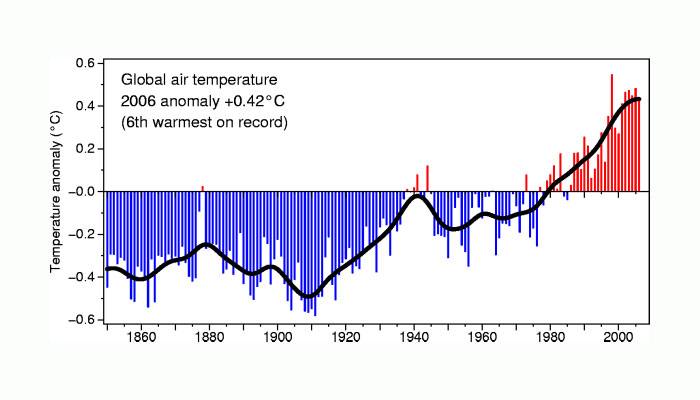
Global temperature change, 1861-2000 and 1000-2000.
Source: IPCC 2001
Studies of the past climate (paleoclimatology) on Earth make extensive use of the ice cores retrieved by Lonnie Thompson and others. One of the fundamental questions that paleoclimatologists are trying to answer is how much of the past variation in climate has been due to changes in the output of the Sun. Understanding how the Earth responds to these changes, and being better able to predict the variation in the solar output, will help us make better predictions of future climate.
Activity on the Sun
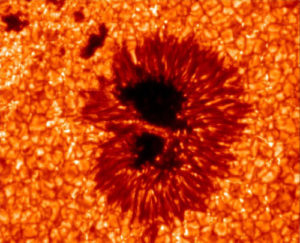
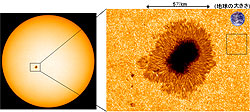
Sunspots are regions of intense magnetism on the Sun. They appear dark because the magnetic regions are about 1,000 degrees cooler than the rest of the Sun’s visible surface or photosphere. See larger image
Source: http://solarb.msfc.nasa.gov/
We might think of the Sun as a benevolent source of light and warmth, but viewed with a telescope, it is incredibly active. Solar storms and eruptions send massive bursts of charged particles our way.When loops of the magnetic field from the Sun’s interior pop through the Sun’s surface, they create sunspots. Sunspots are regions that are actually quite bright but appear dark in photographs because the surrounding areas are even brighter.
Major sunspots are much larger than the Earth. Even though sunspots are cooler regions on the Sun, more sunspots do not mean that there is significantly less solar output. In fact, the total radiative output from Sun is actually larger (by a fraction of a percent) when there are many sunspots present. This is because sunspots are surrounded by a bright rim which more than compensates for the dark interior of the sunspot.
The SOT is the result of an international collaboration by the National Astronomical Observatory of Japan (NAOJ), Lockheed Martin Advanced Technology Center (LMATC), Mitsubishi Electric Corporation (MELCO), NCAR High Altitude Observatory (HAO), NASA MSFC, and the Japan Aerospace Exploration Agency (JAXA). Source: http://solar-b.nao.ac.jp/index_e.shtml
Monitoring Sunspot Activity
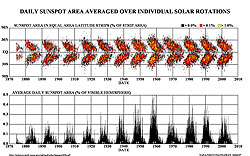
Scientists have noticed that the frequency of sunspots goes up and down according to an 11 year cycle.
Source: Courtesy of David H. Hathaway, NASA Marshall Space Flight Center. http://solarscience.msfc.nasa.gov/SunspotCycle.shtml
The position, number and sizes of sunspots have been monitored nearly continuously ever since the time of Galileo in order. Scientists have noticed that the frequency of sunspots goes up and down according to an 11-year cycle.
Sunspot Activity Throughout History
The Maunder Minimum is a period of from mid-1600’s to early 1700’s when relatively few sunspots were seen on the Sun.
Source: Courtesy of Robert A. Rohde (Global Warming Art) http://www.globalwarmingart.com/wiki/ Image:Sunspot_Numbers.png
The solar sunspot number has not always had a cyclical variation. During the mid-1600s to early 1700s, there were relatively few sunspots seen on the Sun — a period now known as the Maunder Minimum. At the same time as the Maunder Minimum, North America and Europe were experiencing a period where average temperatures were below normal. This lead to some speculation that changes in the Sun’s output could have been the cause for the so-called “Little Ice Age.” This connection has not been unambiguously established, but there is at least one plausible theory which goes something like the following. During times when there are few or no sunspots on the Sun, the Sun’s magnetic field, which fills the entire solar system, is weakened. A weak global solar magnetic field allows more high energy cosmic rays to enter into our solar system and therefore more enter into the Earth’s atmosphere. The higher energy cosmic rays, which are normally deflected by the Sun’s magnetic field, are able to penetrate more deeply into the Earth’s atmosphere than at normal times. There is speculation that higher cosmic ray fluxes may cause increased cloud cover which could be responsible for blocking out more sunlight, thus cooling the Earth’s atmosphere by as much as 1 degree C.
The Sun in X-Rays
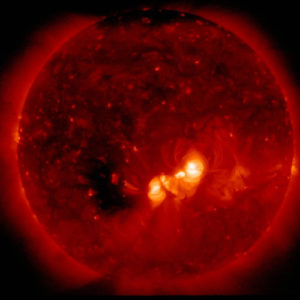
This x-ray image shows regions of intense magnetic fields on the Sun. The fluid motions beneath and on the surface of the Sun can wind up the magnetic fields which sometimes break open to release enormous amounts of energy into Sun’s atmosphere or corona. This energy is emitted in the form of ultraviolet and x-ray light, as well as energetic particles (protons and electrons).
Source: http://hinode.nao.ac.jp/news/061220Press/xrt-full.jpg Hinode/XRT was designed and developed by the Japan-US collaboration between Smithsonian Astrophysical Observatory (SAO), NASA MSFC, JAXA, and NAOJ.
While it is true that the most of the Sun’s radiative output has very little variation over the time scale of the solar activity cycle, the x-ray emission can change by as much as a factor of 10 at certain wavelengths. Orbiting telescopes that are able to image the Sun in ultraviolet and X-rays — light that is normally blocked by the Earth’s atmosphere — have added greatly to our understanding of how sunspots interact with the Sun’s magnetic field.
The Solar Cycle
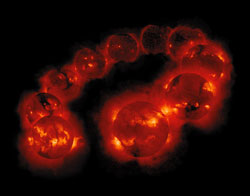
The Changing Sun: 1991-1999. These solar x-ray images from the Yohkoh mission of the Japanese Institute for Space and Astronautical Science (ISAS). These images show how the Sun’s x-ray output changes from its maximum output (in 1991) to minimum (1996) and back to near maximum (1999). Source:http://solar.physics.montana.edu/press/sxt/sxt.html The Yohkoh x-ray telescope was prepared by the Lockheed-Martin Solar and Astrophysics Laboratory, the National Astronomical Observatory of Japan, and the University of Tokyo with the support of NASA and ISAS.
The Sun’s light output changes over the 11-year solar cycle. The most dramatic changes can be seen at the shorter x-ray wavelengths that are invisible to naked eye. Even though most scientists believe that changes in the solar output due to the solar cycle do not have much effect on the Earth’s climate, bigger changes over longer time scales may be important.
Other Stars
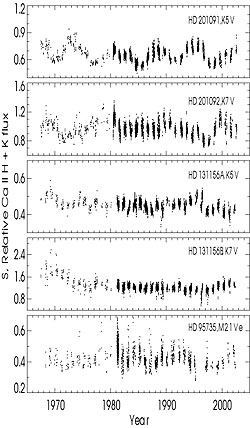
This figure shows five low-mass stars with variations in their ultraviolet output over a period of more than 35 years.
Source: From Baliunas, S., Frick, P., Moss, D., Popova, E., Sokoloff, D. & Soon, W. 2006, Anharmonic and standing dynamo waves: theory and observation of stellar magnetic activity. Monthly Notices of the Royal Astronomical Society 365 (1), 181-190.
Other stars besides the Sun also have activity cycles. Their UV emission can be related to the star’s magnetic activity and hence to the workings of the underlying convection of the electrically conductive plasma, producing in effect a magnetic dynamo under the surface. Scientists believe that it is the dynamo action which creates the stellar magnetic field. Hence by observing many stars, similar to and different from the Sun, we may be able to predict the future changes in our own Sun.

Leonard Strachan
Is an astrophysicist at the Harvard-Smithsonian Center for Astrophysics, where he has been working since 1991. He received his Ph.D. in astronomy from Harvard University. Dr. Strachan is a member of the Ultraviolet Coronagraph Spectrometer (UVCS) team on the Solar and Heliospheric Observatory (SOHO) mission. His research focuses on developing remote sensing techniques and instrumentation for studying the solar corona and solar wind using extreme ultraviolet radiation spectroscopy. His previous experience includes participation in the instrument development and flight operations of the Spartan 201 space shuttle experiment.