


The Habitable Planet: A Systems Approach to Environmental Science
Atmosphere Online Textbook

Researchers use tall towers to obtain air samples that are not affected by local sources and sinks such as vegetation or nearby traffic.
1. Introduction
Unit 2 // Section 1
Earth’s atmosphere is a critical system for life on our planet. Together with the oceans, the atmosphere shapes Earth’s climate and weather patterns and makes some regions more habitable than others. But Earth’s climate is not static. How variable is it, and how quickly does it change? What physical factors control climate, and how do they interact with one another?
To see how and why climate fluctuates, we need to learn about the basic characteristics of the atmosphere and some physical concepts that help us understand weather and climate. This unit describes the structure of the atmosphere and examines some of its key functions, including screening out harmful solar radiation, warming Earth through the natural greenhouse effect, and cycling carbon. It then summarizes how physical processes shape the distributions of pressures and temperatures on Earth to create climate zones, weather patterns, and storms, creating conditions suitable for life around the planet.
The atmosphere is a complex system in which physical and chemical reactions are constantly taking place. Many atmospheric processes take place in a state of dynamic balance—for example, there is an average balance between the heat input to, and output from, the atmosphere. This condition is akin to a leaky bucket sitting under a faucet: when the tap is turned on and water flows into the bucket, the water level will rise toward a steady state where inflow from the tap equals outflow through the leaks. Once this condition is attained, the water level will remain steady even though water is constantly flowing in and out of the bucket.
Similarly, Earth’s climate system maintains a dynamic balance between solar energy entering and radiant energy leaving the atmosphere. Levels of oxygen in the atmosphere are regulated by a dynamic balance in the natural carbon cycle between processes that emit oxygen through photosynthesis and others that consume oxygen, such as respiration. The strength of atmospheric circulation is also controlled by a dynamic balance. Some parts of the planet receive more energy from the sun than others, and this uneven heating creates wind motions that act to move heat from warm to cold regions. (The process by which differential heating triggers atmospheric motion is discussed below in Section 5, “Vertical Motion in the Atmosphere.”)
Today human actions are altering key dynamic balances in the atmosphere. Most importantly, humans are increasing greenhouse gas levels in the troposphere, which raises Earth’s surface temperature by increasing the amount of heat radiated from the atmosphere back to the ground. The broad impacts of global warming are discussed in Unit 12, “Earth’s Changing Climate,” but it should be noted here that climate change will alter factors that are key determinants of environmental conditions upon which ecosystems depend. As the following sections will show, changing global surface temperatures and precipitation patterns will have major impacts on Earth’s climate and weather.
2. The Structure of the Atmosphere
Unit 2 // Section 2
The atmosphere is composed of nitrogen, oxygen, argon, water vapor, and a number of trace gases (Table 1). This composition has remained relatively constant throughout much of Earth’s history. Chemical reactions maintain the ratios of major constituents of the atmosphere to each other. For example, oxygen is released into the atmosphere by photosynthesis and consumed by respiration. The concentration of oxygen in the atmosphere is maintained by a balance between these two processes:
Photosynthesis: CO2 + H2O + light → “CH2O” + O2
Respiration: “CH2O” + O2 → CO2 + H2O + energy
“CH2O” denotes the average composition of organic matter.
Many gases play critical roles in the atmosphere even though they are present in relatively low concentrations. Important substances that will receive further attention throughout this text include tropospheric ozone, which is addressed in Unit 11, “Atmospheric Pollution,” and greenhouse gases (CO2, methane, N2O, and chlorofluorocarbons), which are discussed in Section 4 of this unit and in Unit 12, “Earth’s Changing Climate.”
| Gas | Mole fraction |
|---|---|
| Nitrogen (N2) | 0.78 |
| Oxygen (O2) | 0.21 |
| Water (H2O) | 0.04 to < 5×10⁻³; 4×10⁻⁶ — strat |
| Argon (Ar) | 0.0093 |
| Carbon Dioxide (CO2) | 370×10-6 (date: 2000) |
| Neon (Ne) | 18.2×10⁻⁶ |
| Ozone (O3) | 0.02×10⁻⁶ to 10×10-6 |
| Helium (He) | 5.2×10⁻⁶ |
| Methane (CH4) | 1.7×10⁻⁶ |
| Krypton (Kr) | 1.1×10⁻⁶ |
| Hydrogen (H2) | 0.55×10⁻⁶ |
| Nitrous Oxide (N2O) | 0.32×10⁻⁶ |
| Carbon Monoxide (CO) | 0.03×10⁻⁶ to 0.3×10⁻⁶ |
| Chlorofluorocarbons | 3.0×10⁻⁹ |
| Carbonyl Sulfide (COS) | 0.1×10⁻⁹ |
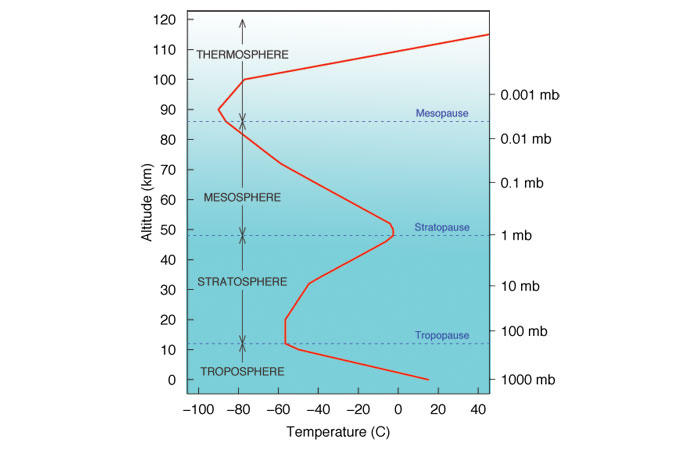
Earth’s atmosphere extends more than 560 kilometers (348 miles) above the planet’s surface and is divided into four layers, each of which has distinct thermal, chemical, and physical properties (Fig. 1).
 Figure 1. Structure of the atmosphere
Source: © 2006. Steven C. Wofsy, Abbott Lawrence Rotch Professor of Atmospheric and Environmental Science, lecture notes.
Almost all weather occurs in the troposphere, the lowest layer of the atmosphere, which extends from the surface up to 8 to 16 kilometers above Earth’s surface (lowest toward the poles, highest in the tropics). Earth’s surface captures solar radiation and warms the troposphere from below, creating rising air currents that generate vertical mixing patterns and weather systems, as detailed further below. Temperatures decrease by about 6.5°C with each kilometer of altitude. At the top of the troposphere is the tropopause, a layer of cold air (about -60°C), which forms the top of the troposphere and creates a “cold trap” that causes atmospheric water vapor to condense.
The next atmospheric layer, the stratosphere, extends upward from the tropopause to 50 kilometers. In the stratosphere temperatures increase with altitude because of absorption of sunlight by stratospheric ozone. (About 90 percent of the ozone in the atmosphere is found in the stratosphere.) The stratosphere contains only a small amount of water vapor (only about one percent of total atmospheric water vapor) due to the “cold trap” and the tropopause, and vertical air motion in this layer is very slow. The stratopause, where temperatures peak at about -3°C, marks the top of the stratosphere.
In the third atmospheric layer, the mesosphere, temperatures once again fall with increasing altitude, to a low of about -93°C at an altitude of 85 kilometers. Above this level, in the thermosphere, temperatures again warm with altitude, rising higher than 1700°C.
The atmosphere exerts pressure at the surface equal to the weight of the overlying air. Figure 1 also shows that atmospheric pressure declines exponentially with altitude—a fact familiar to everyone who has felt pressure changes in their ears while flying in an airplane or climbed a mountain and struggled to breathe at high levels. At sea level, average atmospheric pressure is 1013 millibars, corresponding to a mass of 10,000 kg (10 tons) per square meter or a weight of 100,000 Newtons per square meter (14.7 pounds per square inch) for a column of air from the surface to the top of the atmosphere.
Pressure falls with increasing altitude because the weight of the overlying air decreases. It falls exponentially because air is compressible, so most of the mass of the atmosphere is compressed into its lowest layers. About half of the mass of the atmosphere lies in the lowest 5.5 kilometers (the summit of Mt. Everest at 8850 m extends above about roughly two-thirds of the atmosphere), and 99 percent is within the lowest 30 kilometers.
3. Radiative Balance and the Natural Greenhouse Effect
Unit 2 // Section 3
Earth’s surface temperature has been remarkably constant over geologic time. Even the dramatic cooling that occurred during the most recent ice age represented a change of only 3°C in the global average surface temperature, occurring over thousands of years. Seasonal changes in temperature, although large in a particular place, correspond to very tiny changes in global mean temperature. Why have temperatures held so steady?
Earth exchanges energy with its environment primarily through transfers of electromagnetic radiation. At any time our planet is simultaneously absorbing energy from the sun and radiating energy back into space. The temperature remains stable over long periods of time because the planet radiates energy back to space at a rate that closely balances the energy input it receives from the sun (i.e., the planet is close to being in radiative energy balance).
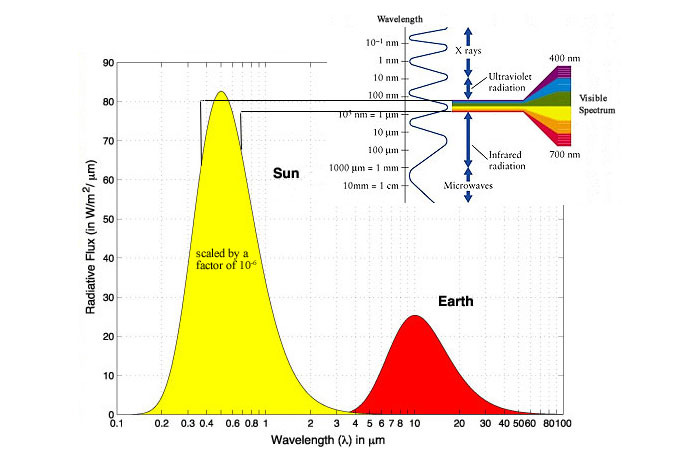
Earth receives energy from the sun in the form of solar radiation—radiation with varying wavelengths along the electromagnetic spectrum. The sun emits strongly in the visible light range, but it also produces ultraviolet and infrared radiation. The earth radiates heat back to space mostly at much longer wavelengths than solar radiation (Fig. 2).
 Figure 2. The electromagnetic spectrum
Source: © Yochanan Kushnir.
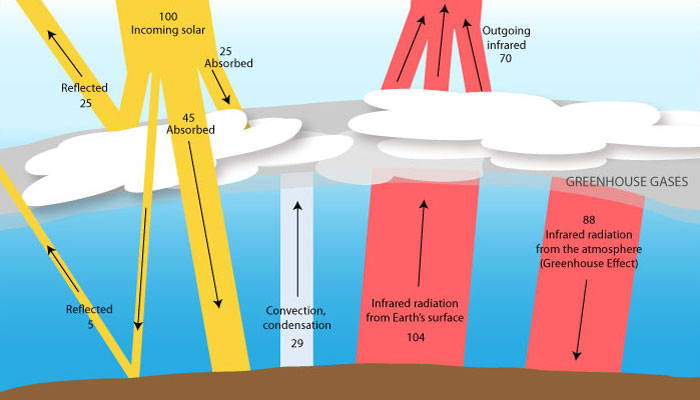
When visible solar radiation reaches Earth, it may be absorbed by clouds, the atmosphere, or the planet’s surface. Once absorbed it is transformed into heat energy, which raises Earth’s surface temperature. However, not all solar radiation intercepted by the Earth is absorbed. The fraction of incoming solar radiation that is reflected back to space constitutes Earth’s albedo>, as shown below in Figure 3.

Figure 3. Earth-atmosphere energy balance
See larger image
Any form of matter emits radiation if its temperature is above absolute zero (zero degrees Kelvin). Incoming solar radiation warms Earth, and the planet emits infrared radiation back to outer space. Note that Earth emits radiation at a longer wavelength—i.e., a lower energy level—than the sun (Fig. 2). This difference occurs because the total energy flux from an object varies with the fourth power of the object’s absolute temperature, and the sun is much hotter than the Earth.
Some outgoing infrared energy emitted from the Earth is trapped in the atmosphere and prevented from escaping to space, through a natural process called the “greenhouse effect.” The most abundant gases in the atmosphere—nitrogen, oxygen, and argon—neither absorb nor emit terrestrial or solar radiation. But clouds, water vapor, and some relatively rare greenhouse gases (GHGs) such as carbon dioxide, methane, and nitrous oxide in the atmosphere can absorb long-wave radiation (terrestrial radiation, see Figure 2). Molecules that can absorb radiation of a particular wavelength can also emit that radiation, so GHGs in the atmosphere, therefore will radiate energy both to space and back towards Earth. This back-radiation warms the planet’s surface.
In Figure 3, 100 units of solar radiation are intercepted by the Earth each second. On average 30 units are reflected, 5 by the surface and 25 by clouds. Energy balance is achieved by Earth’s emission of 70 units of infrared (“terrestrial”) radiation to space. The earth’s surface is warmed directly by only 45 units of solar energy, with almost twice as much energy (88 units) received from thermal radiation due to greenhouse gases and clouds in the atmosphere. Energy is removed from the surface by radiation of infrared energy back to the atmosphere and space (104 units) and by other processes such as evaporation of water and direct heat transfer (29 units).
Note that the amount of heat received by the surface is actually much larger (3x) than the amount the surface receives in solar radiation, due to the natural greenhouse effect. The result is a surface temperature on average around 15°C (60°F), as compared to temperatures colder than –18°C (0°F) if there were no greenhouse effect.
4. Major Greenhouse Gases
Unit 2 // Section 4
Many GHGs, including water vapor (the most important), ozone, carbon dioxide, methane, and nitrous oxide, are naturally present in the atmosphere. Other GHGs are synthetic chemicals that are emitted only as a result of human activity. Anthropogenic (human) activities are significantly increasing atmospheric concentrations of many GHGs.
- Carbon dioxide (CO2), the most significant GHG directly affected by anthropogenic activity, is the product of the oxidation of carbon in organic matter, either through combustion of carbon-based fuels or the decay of biomass. Natural CO2 sources include volcanic eruptions, respiration of organic matter in natural ecosystems, natural fires, and exchange of dissolved CO2 with the oceans. The main anthropogenic sources are (a) fossil fuel combustion and (b) deforestation and land use changes (such as converting agricultural land or forests to urban development), which release stored organic matter and reduce the ability of natural ecosystems to store carbon.
- Methane (CH4) is produced by anaerobic decay of organic material in landfills, wetlands, and rice fields; enteric fermentation in the digestive tracts of ruminant animals such as cattle, goats, and sheep; manure management; wastewater treatment; fossil fuel combustion; and leaks from natural gas transportation and distribution systems and abandoned coal mines.
- Nitrous oxide (N2O) is produced by fertilizer use, animal waste management, fossil fuel combustion, and industrial activities.
- Hydrofluorocarbons (HFCs) and perfluorocarbons (PFCs) are synthetic chemicals that are used in a variety of industrial production processes such as semiconductor manufacturing. PFCs are also produced as a by-product of aluminum smelting. Both groups of chemicals are finding increasing use as substitutes for ozone-depleting chlorofluorocarbons (CFCs), which are being phased out under the 1987 Montreal Protocol on Substances that Deplete the Ozone Layer. HFCs and PFCs are replacing CFCs in applications such as refrigeration and foam-blowing for insulation.
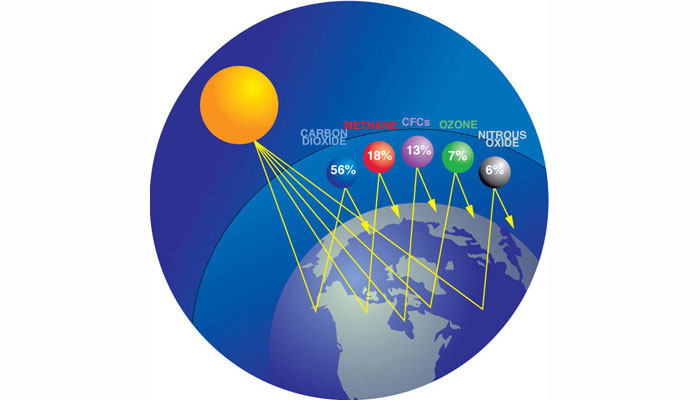
When atmospheric GHG concentrations increase, Earth temporarily traps infrared radiation more efficiently, so the natural radiative balance is disturbed until its surface temperature rises to restore equilibrium between incoming and outgoing radiation. It takes many decades for the full effect of greenhouse gases to be realized in higher surface temperatures because the oceans have a huge capacity to store heat. They must be gradually warmed by excess infrared radiation from the atmosphere. Figure 4 illustrates the relative contributions from man-made emissions of various GHGs to climate change.

Figure 4. Importance of human-produced greenhouse gases
See larger image
Source: Courtesy Marian Koshland Science Museum of the National Academy of Sciences http://www.koshland-science-museum.org.
As we will see in section 8, “The Global Carbon Cycle,” CO2 emitted from combustion of fossil fuel cycles between the atmosphere and land and ocean “sinks” (carbon storage reservoirs), which are absorbing a large fraction of anthropogenic carbon emissions. Ultimately, though, there are limits to the amount of carbon that these sinks can absorb. These sinks are more likely to delay than to prevent human actions from altering Earth’s radiative balance.
Higher surface temperatures on Earth will have profound impacts on our planet’s weather and climate. Before we consider those impacts, however, we need to understand how variables such as pressure, temperature, and moisture combine to create air currents, drive normal atmospheric circulation patterns, and create the overall climate.
5. Vertical Motion in the Atmosphere
Unit 2 // Section 5
To see how atmospheric motion generates climate and weather systems, it is useful to start by picturing an air parcel—a block of air with uniform temperature and pressure throughout. The air parcel can change over time by rising, falling, or emitting or absorbing heat. If the pressure of the surrounding environment changes, the pressure of the parcel changes, but it does not exchange heat or chemicals with the surroundings and therefore may behave differently from its surroundings.
Many weather patterns start with rising air. According to the Perfect Gas Law, if an air parcel stays at a constant pressure, increasing its temperature will cause it to expand and become less dense. Contrary to popular belief, however, air does not rise simply because it is warm. Rather, air that becomes warmer than its surroundings—for example, if it is warmed by heat radiating from the Earth’s surface—becomes buoyant and floats on top of cooler, denser air in the same way that oil floats on top of water. This buoyant motion is called convection.
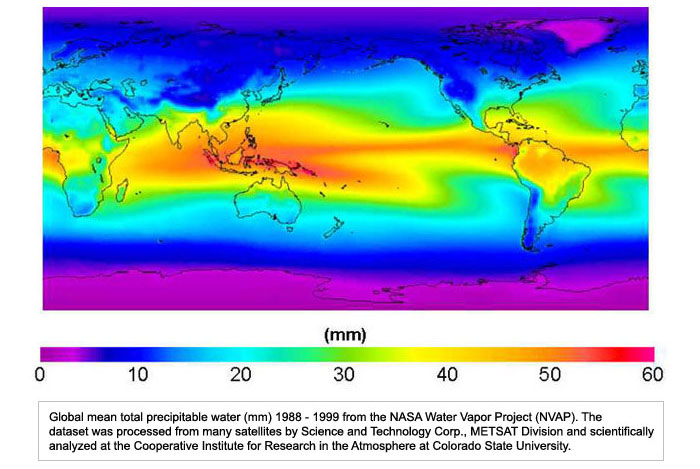
Water is also a key factor in weather and climate. As shown in Table 1, two to three percent of the atmosphere typically consists of water vapor. Weather forecasts often report the relative humidity, which compares the amount of water vapor in the air to the maximum amount that air can hold at that temperature. When relative humidity reaches 100 percent, the air has reached saturation pressure and cannot absorb any more water vapor. (High humidity levels make people feel uncomfortable because little or none of their sweat can evaporate and draw heat from their skin.) As air warms, the amount of water vapor that it can hold rises exponentially. Consequently, atmospheric water vapor concentrations are highest in warm regions and decrease toward the poles (Fig. 5).

Figure 5. Mean distribution of atmospheric water vapor above Earth’s surface, 1988–1999
See larger image
Source: Courtesy Cooperative Institute for Research in the Atmosphere, Colorado State University.
Atmospheric water vapor contributes to weather patterns in several ways. First, adding water vapor to the air reduces its density, so adding moisture to dry air may make it become buoyant and rise. Secondly, moist air carries latent energy, the potential for condensation of water vapor to heat the air. Liquid water absorbs energy when it evaporates, so when this water vapor condenses, energy is released and warms the surrounding environment. (As we will see in the next section, thunderstorms and hurricanes draw energy from the release of latent heat.) The dew point, another key weather variable, denotes the temperature to which air would have to cool to reach 100 percent relative humidity. When an air parcel cools to its dew point, water vapor begins condensing and forming cloud droplets or ice crystals, which may ultimately grow large enough to fall as rain or snow.
When a rising air parcel expands it pushes away the surrounding atmosphere, and in doing this work it expends energy. If heat is not added or removed as this hypothetical parcel moves—a scenario called an adiabatic process—the only source of energy is the motion of molecules in the air parcel, and therefore the parcel will cool as it rises. (Recall from Figure 1 that that in the troposphere, temperature falls 6.5°C on average with each kilometer of altitude. The actual decrease under real-world conditions, which may vary from region to region, is called the atmospheric lapse rate.)
A dry air parcel (one whose relative humidity is less than 100 percent) cools by 9.8°C for each thousand meters that it rises, a constant decrease called the dry adiabatic lapse rate. However, if the parcel cools enough that its relative humidity reaches 100 percent, water starts to condense and form cloud droplets. This condensation process releases latent heat into the parcel, so the parcel cools at a lower rate as it moves upward, called the moist adiabatic lapse rate.
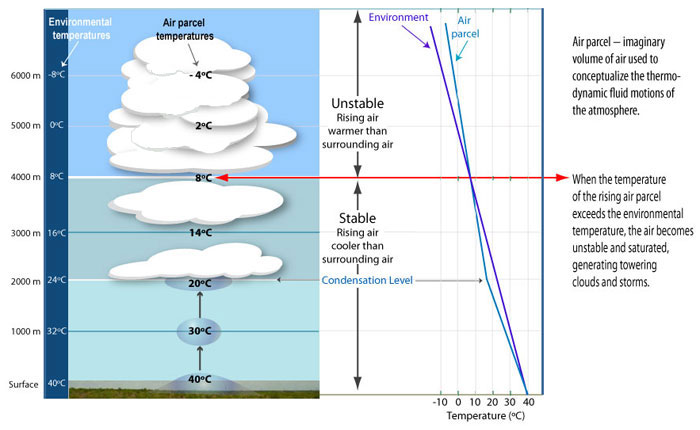
Atmospheric conditions can be stable or unstable, depending on how quickly the temperature of the environment declines with altitude. An unstable atmosphere is more likely to produce clouds and storms than a stable atmosphere. If atmospheric temperature decreases with altitude faster than the dry adiabatic lapse rate (i.e., by more than 9.8°C per kilometer), the atmosphere is unstable: rising air masses will be warmer and less dense than the surrounding air, so they experience buoyancy and will continue to rise and form clouds that can generate storms. If temperature falls more gradually with altitude than the dry adiabatic lapse rate but more steeply than the wet adiabatic lapse rate, the atmosphere is conditionally unstable. In this case, air masses may rise and form clouds if they contain enough water vapor to warm them as they expand (Fig. 6), but they have to get a fairly strong push upwards to start the condensation process (up to 4000 meters in the figure). If temperature falls with altitude more slowly than the moist adiabatic lapse rate, the atmosphere is stable: rising air masses will become cooler and denser than the surrounding atmosphere and sink back down to where they started.

Figure 6. Conditional instability
See larger image
Convection is not the only process that lifts air from lower to higher altitudes. When winds run into mountains and are forced upward the air cools, often forming clouds over windward slopes and the crests of hills. Convergence occurs when air masses run together, pushing air upward, as happens often in the tropics and in warm summer conditions in midlatitudes, generating thunderstorms. And when warm and cold air fronts collide, the denser cold air slides underneath the warm air layer and lifts it. In each case, if warm air is lifted high enough to reach its dew point, clouds will form. If lifting forces are strong, the system will produce tall, towering clouds that can generate intense rain or snowstorms.
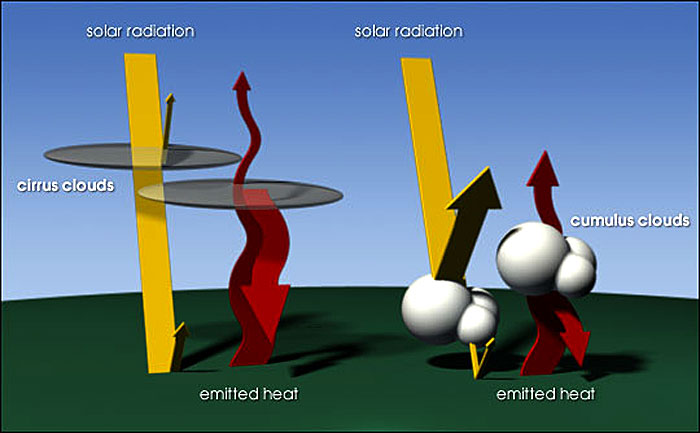
As discussed in section 9, “Feedbacks in the Atmosphere,” clouds are important factors in Earth’s energy balance. Their net impact is hard to measure and model because different types of clouds have different impacts on climate. Low-altitude clouds emit and absorb infrared radiation much as the ground does, so they are roughly the same temperature as Earth’s surface and thus do not increase atmospheric temperatures. However, they have a cooling effect because they reflect a portion of incoming solar radiation back into space, increasing Earth’s albedo and reducing the total input of solar energy to the planet’s surface.
In contrast, high-altitude clouds tend to be thinner, so they do not reflect significant levels of incoming solar radiation. However, since they reside in a higher, cooler area of the atmosphere, they efficiently absorb outgoing thermal radiation and warm the atmosphere, and they radiate heat back to the surface from a part of the atmosphere that would otherwise not contribute to the greenhouse effect.
6. Atmospheric Circulation Patterns
Unit 2 // Section 6
Atmospheric circulation is set up when mass moves in the atmosphere. This motion may be vertical, as when warm air rises and becomes buoyant. It can also be horizontal: wind is created by air moving from high pressure areas, where air is densely compressed, to low-pressure areas, where air is less dense, although horizontal winds follow curved trajectories due to the rotation of the earth (see below). Atmospheric forces cause the air to move, modifying the difference in pressure. On a weather map, pressure differences are demarcated by parallel lines called isobars that show changes in pressure, usually in increments of 2 to 4 millibars.
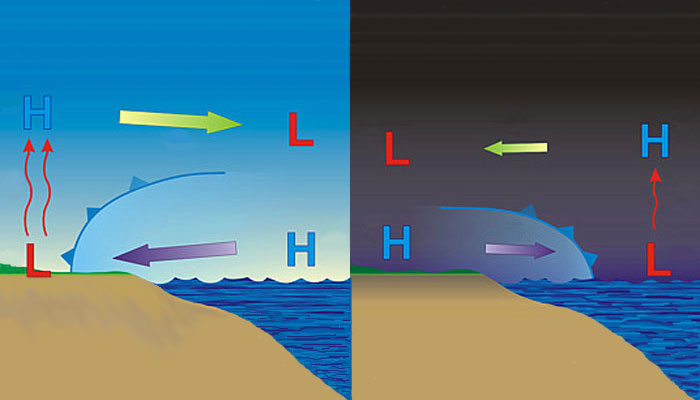
Sea breezes show how vertical and horizontal movements combine to modify temperature and pressure at a local level. During the day coastal land regions heat up more than the sea because land warms more quickly than water. Air over the land is thus warmed and rises, increasing pressure in the atmosphere above the surface, where it starts to cool and form clouds. It then flows at altitude from the area of high pressure over land to lower pressure over the sea. Because there is then less mass over the land and moreover the sea, pressure at the surface is higher at sea, so air flows in from the sea to the land. At night, when land cools more quickly than the ocean, the cycle is reversed (Fig. 7).

Figure 7. Sea breeze
See larger image
Source: Adapted from graphic by National Oceanic Atmospheric Administration, Jet Stream.
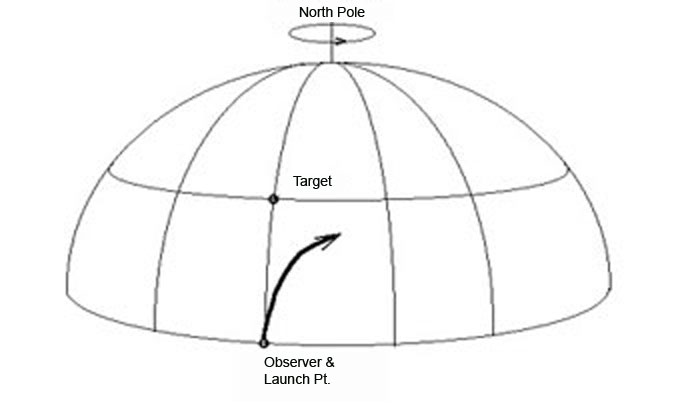
The sea breezes in this example flow directly between two points, but many larger weather systems follow less-direct courses. Their paths are not random, however. Winds that move over very long distances appear to curve because of the Coriolis force, an apparent force caused by Earth’s rotation. This phenomenon occurs because all points on the planet’s surface rotate once around Earth’s axis every 24 hours, but different points move at different speeds: air at a point on the equator rotates at 1,700 kilometers per hour, compared to 850 kilometers per hour for a point that lies at 60 degrees latitude, closer to Earth’s spin axis.
Because Earth spins, objects on its surface have angular momentum, or energy of motion, which defines how a rotating object moves around a reference point. An object’s angular momentum is the product of its mass, its velocity, and its distance from the reference point (its radius). Angular momentum is conserved as an object moves on the Earth, so if its radius of spin decreases (as it moves from low latitude to high latitude), its velocity must increase. This relationship is what makes figure skaters rotate faster when they pull their arms in close to their bodies during spins.
The same process affects a parcel of air moving north from the Equator toward the pole: its radius of spin around Earth decreases as it moves closer to Earth’s axis of rotation, so its rate of spin increases. The parcel’s angular velocity is greater than the angular velocity of Earth’s surface at the higher latitude, so it deflects to the right of its original trajectory relative to the planet’s surface (Fig. 8). In the Southern hemisphere, the parcel would appear to deflect to the left.

Figure 8. Coriolis force
See larger image
Source: © 2006. Steven C. Wofsy, Abbott Lawrence Rotch Professor of Atmospheric and Environmental Science, lecture notes.
This effect was discovered by French scientist Gustave-Gaspard Coriolis, who sought to explain why shots fired from long-range cannons were falling wide to the right of their targets. The Coriolis force only affects masses that travel over long distances, so it is not apparent in local weather patterns such as sea breezes. Nor, contrary to an oft-repeated misbelief, does it make water draining from a sink or toilet rotate in one direction in the Northern Hemisphere and the other direction in the Southern Hemisphere. But the Coriolis force makes winds appear to blow almost parallel to isobars, rather than directly across them from high to low pressure.
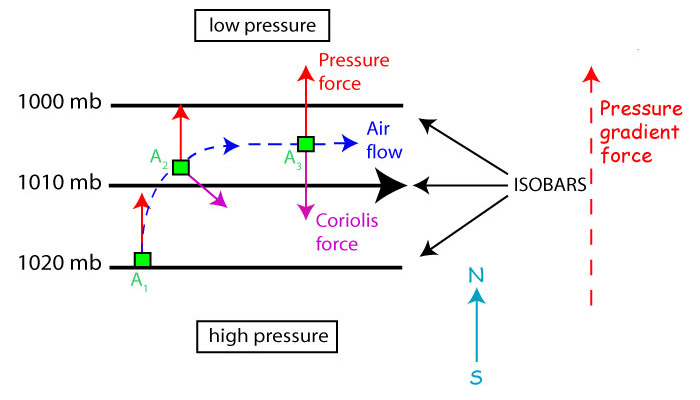
The Coriolis force makes the winds in low-pressure weather systems such as hurricanes rotate (counterclockwise in the Northern Hemisphere and clockwise in the Southern Hemisphere), curving into spirals. Air initially starts to move through the atmosphere under the influence of pressure gradients that push it from high pressure to low pressure areas. As it travels, the Coriolis force starts to bend its course. The motion tends toward a state called geostrophic flow, where the pressure gradient force and the Coriolis force exactly balance each other. At this point the air parcel is no longer moving from a high-pressure to a low-pressure zone. Instead, it follows a course parallel to the isobars. In Figure 9, the air parcel is in geostrophic flow at point A3.

Figure 9. Geostrophic flow
See larger image
Source: © 2006. Steven C. Wofsy, Abbott Lawrence Rotch Professor of Atmospheric and Environmental Science, lecture notes.
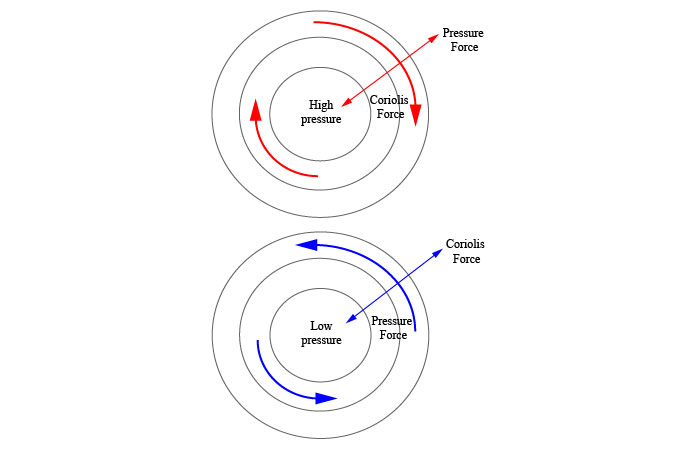
When a low-pressure region develops in the Northern Hemisphere, pressure forces direct air from the outside toward the low. Air that moves in as a response to this force is deflected to the right and rotates counter-clockwise around the system. In contrast, a region of high pressure produces a pressure force directed away from the high. Air starting to move in response to this force is deflected to the right (in the Northern Hemisphere), producing a clockwise circulation pattern around a region of high pressure (Fig. 10).

Figure 10. Circulation of air around regions of high and low pressure in the Northern Hemisphere
See larger image
Source: © 2006. Steven C. Wofsy, Abbott Lawrence Rotch Professor of Atmospheric and Environmental Science, lecture notes.
This pattern is modified at altitudes below 1 kilometer as friction with objects on the ground slows winds down. As wind speed declines, so does the Coriolis force, but pressure gradient forces stay constant. As a result, winds near the ground are deflected toward low pressure areas. Air parcels will spiral into low pressure areas near the surface, then rise once they reach the center. As the air rises, it cools, producing condensation, clouds, and rain. In contrast, air parcels will spiral away from high pressure areas near the surface toward low pressure areas. To maintain barometric balance, air will descend from above. In the process, the descending air will warm and its relative humidity will decrease, usually producing sunny weather (Fig. 11).

Figure 11. Winds around highs and lows
See larger image
Source: © 2006. Steven C. Wofsy, Abbott Lawrence Rotch Professor of Atmospheric and Environmental Science, lecture notes.
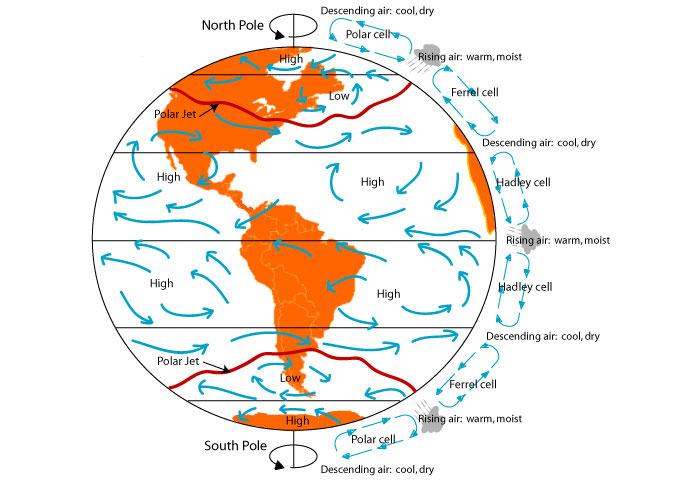
The first attempt to show how weather patterns combined to produce a general circulation of the atmosphere was offered in 1735 by English meteorologist George Hadley. Hadley pictured global-scale circulation as a large-scale version of the local system pictured above in Figure 7: a vast sea breeze with warm air rising over the equator and sinking over the poles. Hadley wanted to explain why sailors encountered westerly winds at midlatitudes and easterly “trade winds” near the equator. He deduced that this trend was caused by the Earth’s rotation.
Hadley’s model was accurate in many respects. Due to differential heating of the Earth with more warmth near the equator and cooling by radiation to space, buoyancy develops at low latitudes and mass is moved upward and poleward in the atmosphere, creating pressure gradients. The atmosphere tries to set up a simple circulation, upwelling near the equator and descending in polar regions, but in reality the Hadley circulation terminates at a latitude of about 30°. At this point, air sinks to the ground and flows back to the tropics, deflected by the Coriolis force, which produces easterly winds near the surface at low latitudes (“trade winds”) and westerly winds at high latitudes. Farther north and south, this pattern repeats in two more sets of circulation zones, or “cells,” between the tropics and the poles (Fig. 12). The strength of the atmospheric circulation is controlled by a dynamic balance between motions caused by differential heating and friction that slows down the winds.

Figure 12. General circulation of the atmosphere
See larger image
See larger image
7. Climate, Weather, and Storms
Unit 2 // Section 7
Climate and weather are tightly connected, but it is important to distinguish between them. Climate refers to long-term weather trends and the range of variations that can be detected over decades in a specific region. Specific weather trends like annual snowfall may vary widely from one year to another (as a famous saying puts it, “Climate is what you expect, weather is what you get”), but forecasters can predict that these trends will fall within certain ranges over time based on long-term climate records. For example, southern Arizona has a hot, dry climate but its weather patterns include heavy rainstorms in July and August.
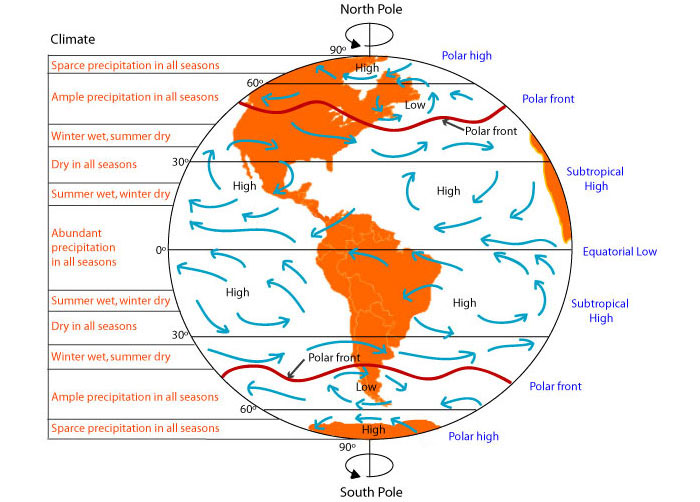
The global circulation patterns described in the preceding sections create predictable regional climate zones (Fig. 13). Low-pressure belts at the equator and at 50° to 60° north and south latitudes generate abundant precipitation. At latitudes around 30° north and south, dry descending air from high pressure belts—like the descending flow in a sea breeze circulation—produces arid zones that include Earth’s major deserts.

Each hemisphere has a number of distinct climate zones with characteristic weather patterns.
Figure 13. Global circulation and climate
See larger image
Because the Coriolis effect prevents mass and heat from moving readily to polar latitudes, temperatures decline and pressures increase sharply between middle latitudes and the polar regions. This sharp pressure gradient creates powerful jet stream winds flowing from west to east at the boundary area. Jet stream winds meander and transport heat as they shift northward and southward. In the process they bring much of the weather system activity in the middle latitudes. When the mid-latitude jet stream dips down from Canada into the United States during the winter, it can carry arctic air and winter storms into the southeastern states.
To see how local climatic conditions create specific weather patterns, consider two types of storms: hurricanes and mid-latitude cyclones. Hurricanes form over tropical waters (between 8° and 20° latitude) in areas with high humidity, light winds, and warm sea surface temperatures, typically above 26.5°C (80°F). The most active area is the western Pacific, which contains a wide expanse of very warm ocean water. More hurricanes occur annually in the Pacific than in the Atlantic, which is a smaller area and therefore provides a smaller expanse of warm ocean water.
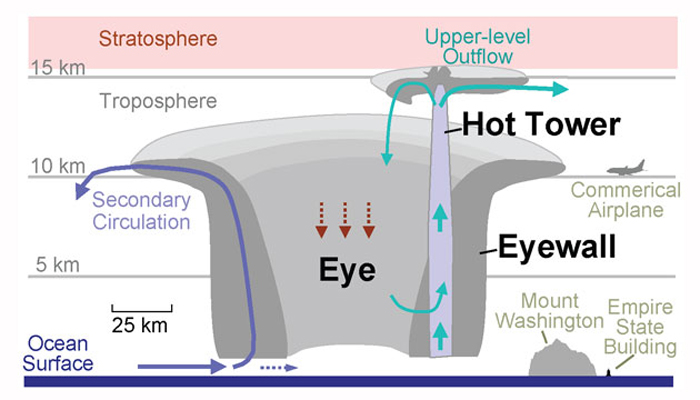
The first sign of a potential hurricane is the appearance of a tropical disturbance (cluster of thunderstorms). At the ocean’s surface a feedback loop sometimes develops: falling pressure pulls in more air at the surface, which makes more warm air rise and release latent heat, which further reduces surface pressure. The Coriolis force will lead the converging winds into a counterclockwise circulation around the storm’s lowest-pressure area.
Meanwhile, air pressure near the top of the storm starts to rise in response to latent heat warming. This high-pressure zone makes air diverge (flow outward) around the top of the center of the system. It then drops to the ground, forming powerful winds (Fig. 14). This upper-level area of high pressure acts like a chimney to vent the tropical system and keeps the air converging at the surface from piling up around the center. If air were to pile up at the center, surface pressure would rise inside the storm and ultimately weaken or destroy it.

Figure 14. Hurricane wind patterns
See larger image
See larger image
Source: © National Aeronautics and Space Administration, Goddard Space Flight Center.
At the surface hurricanes can diminish quickly if they move over cooler water or land and lose their supplies of warm, moist tropical air, or if they move into an area where the large-scale flow aloft is not favorable for continued development or maintenance of the circulation.
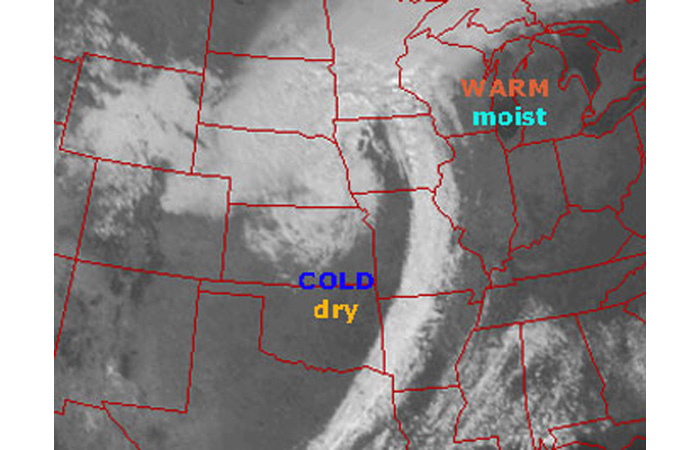
Mid-latitude cyclones cause most of the stormy weather in the United States, especially during the winter season. They occur when warm tropical and cold polar air masses meet at the polar front (coincident with the jet stream). Typically, warm air is lifted over the colder air and the system starts to move into a spiral. Because mid-latitude systems create buoyancy through lifting, their strongest wind velocities are at high altitudes (Fig. 15). In contrast, hurricanes generate buoyancy from rising warm air, so their highest velocities are at the surface where pressure differences are greatest.

Figure 15. Mid-latitude cyclones along the polar front
See larger image
See larger image
Source: © Dr. Michael Pidwimy, University of British Columbia Okanagan.
In many parts of the globe, atmospheric dynamics and ocean circulation patterns interact to create other distinct climate cycles that occur over longer periods than a single storm. Examples include seasonal monsoon rainstorms in Asia and the American southwest and multi-year patterns such as the El Niño Southern Oscillation (ENSO). These climate cycles are discussed in detail in Unit 3, “Oceans.”
8. The Global Carbon Cycle
Unit 2 // Section 8
As this unit shows, temperature and moisture levels are major variables shaping Earth’s weather patterns. By increasing atmospheric concentrations of greenhouse gases through activities such as burning fossil fuels, humans are changing the planet’s radiative balance. This process is altering global temperatures and moisture levels, so we can expect that it will change Earth’s weather patterns. One of the key issues in current atmospheric science research is understanding how GHG emissions affect natural cycling of carbon between the atmosphere, oceans, and land. The rate at which land and ocean sinks take up carbon will determine what fraction of man-made CO2emissions remain in the atmosphere and alter Earth’s radiative balance.
Atmospheric levels of CO2, the most important anthropogenic greenhouse gas, are controlled by a dynamic balance among biological and inorganic processes that make up the carbon cycle. These processes operate on very diverse time scales ranging from months to geological epochs. Today, human intervention in the carbon cycle is disturbing this natural balance. As a result, atmospheric CO2 concentrations are rising rapidly and are already significantly higher than any levels that have existed for at least the past 650,000 years.
In recent decades, only about half of the CO2 added to the atmosphere by human activities has stayed in the atmosphere. The rest has been taken up and stored in the oceans and in terrestrial ecosystems. The basic processes through which land and ocean sinks (storage reservoirs) take up carbon are well understood, but there are many questions about how much anthropogenic carbon these sinks can absorb, which sinks are taking up the largest shares, and how sensitive these sinks are to various changes in the environment. These issues are concerns for atmospheric scientists because carbon that cannot be taken up by land and ocean sinks will ultimately end up in the atmosphere. By monitoring atmospheric concentrations of CO2 and other greenhouse gases, scientists are working to understand the operation of natural carbon sinks more accurately (Fig. 16).
“We use the atmosphere as a diagnostic to get a handle on these processes—to quantify where they take place and how long they are. If we can get an understanding of what the Earth itself is doing with these excess gases, we can make better prognoses of what future climate change might be like.”
Dr. Pieter Tans, National Oceanographic and Atmospheric Administration

Figure 16. Tall tower monitoring station for atmospheric sampling
See larger image
See larger image
The carbon cycle can be viewed as a set of reservoirs or compartments, each of which holds a form of carbon (such as calcium carbonate in rocks or CO2 and methane in the atmosphere), with carbon moving at various natural rates of transfer between these reservoirs (Fig. 17). The total amount of carbon in the system is fixed by very long-term geophysical processes such as the weathering of rock. Human actions that affect the carbon cycle, such as fossil fuel combustion and deforestation, change the rate at which carbon moves between important reservoirs. Burning fossil fuels speeds up the “weathering” of buried hydrocarbons, and deforestation accelerates the natural pace at which forests die and decompose, releasing carbon back to the atmosphere.

Figure 17. Global carbon cycle
See larger image
See larger image
Source: © Climate Change 2007: The Physical Scientific Basis, Intergovernmental Panel on Climate Change.
The residence time of carbon varies widely among different reservoirs. On average a carbon atom spends about 5 years in the atmosphere, 10 years in terrestrial vegetation, and 380 years in intermediate and deep ocean waters. Carbon can remain locked up in ocean sediments or fossil fuel deposits for millions of years. Fast cycling processes that take place in months or a few years have rapid effects but only influence small CO2 reservoirs, so they do not change long-term CO2 levels significantly. Slow processes that take place over centuries, millennia, or geologic epochs have greater influence on CO2 concentrations over the long term.
Two processes remove CO2 from the atmosphere: photosynthesis by land plants and marine organisms, and dissolution in the oceans. There is an important distinction between these processes in terms of permanence. CO2 taken up through photosynthesis is converted into organic plant material, whereas CO2 dissolved in the oceans is transferred to a new carbon reservoir but remains in inorganic form. Organic carbon in plant tissues can remain sequestered for thousands or millions of years if it is buried in soils or deep ocean sediments, but it returns to the atmosphere quickly from material such as leaf litter. Similarly, CO2 dissolved in the oceans will stay a long time if sequestered in deep water, but will escape more readily back into the atmosphere if ocean mixing brings it to the surface.
Oceans and land ecosystems thus serve as both sources and sinks for carbon. Until recently these processes were in rough equilibrium, but the balance is being disrupted today as human activities add more carbon to the atmosphere and a large fraction of that anthropogenic carbon is transferred to the oceans. Therefore, it is important to understand the chemical and biological processes through which the oceans take up CO2.
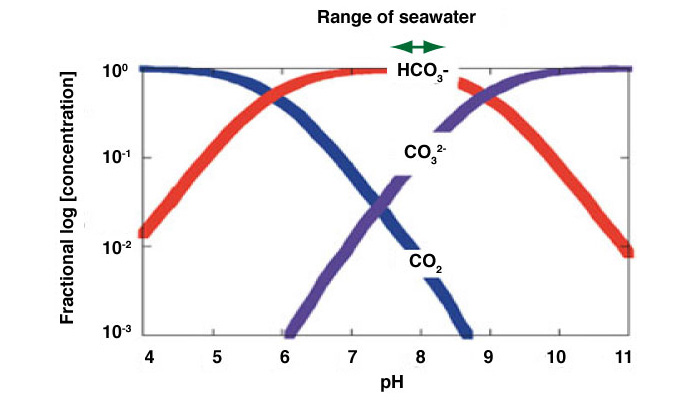
Atmospheric CO2 dissolves into surface waters, where it reacts with liquid water to form carbonic acid, carbonate, and bicarbonate. This process makes the oceans an important buffer against global climate change, but there are limits to how much CO2the oceans can absorb. Seawater is slightly basic, with a pH value of 8.2. Adding CO2acidifies the water. Dissolved CO2 gas reacts with carbonate (CO3 2-) ions in the water, increasing concentrations of H+ and other hydrogen ions, which drives pH values lower (Fig. 18).

Figure 18. Relative proportions of inorganic forms of CO2 dissolved in seawater
See larger image
See larger image
Source: © 2005. British Royal Society Report, Ocean Acidification Due to Increasing Atmospheric Carbon Dioxide, p. vi.
Over the long term, reducing the concentration of carbonate ions will slow the rate at which oceans take up CO2. However, this process could significantly alter ocean chemistry. The British Royal Society estimated in a 2005 report that uptake of anthropogenic CO2 emissions had already reduced the pH of the oceans by 0.1 units, and that the average pH of the oceans could fall by 0.5 units by 2100 if CO2emissions from human activities continued to rise at their current pace (footnote 1).
Theoretically, the oceans could absorb nearly all of the CO2 that human activities are adding to the atmosphere. However, only a very small portion of the ocean (the mixed layer, discussed further in Unit 3, “Oceans”) comes into close contact with the atmosphere in a year. It would take about 500 years for all ocean water to come into contact with the atmosphere. As we will see in Unit 12, “Earth’s Changing Climate,” solutions to climate change are needed on a faster scale.
As noted above, biological uptake in the oceans occurs when phytoplankton in surface waters use CO2 during photosynthesis to make organic matter. The organic carbon stored in these organisms is then transferred up the food chain, where most is turned back into CO2. However, some ultimately falls to lower depths and is stored in deep ocean waters or in ocean sediments, a mechanism called the “biological pump” (for more details, see Unit 3, “Oceans”).
Forests take up CO2 through photosynthesis and store carbon in plant tissue, forest litter, and soils. Forests took up a rising share of CO2 from fossil fuel combustion in the 1980s and 1990s. Scientists believe that this occurred mainly because forests in the Northeastern United States and similar areas in Europe, many of which were clear-cut or used for agriculture in the 1700s and 1800s, have been growing back with the decline of agriculture in the region (Fig. 19).

Figure 19. Farm abandonment (1850) and hardwood forest regrowth (1930) in central New England
See larger image
See larger image
Source: © Harvard Forest Dioramas, Fisher Museum, Harvard Forest, Petersham, MA. Photography is by John Green and David Foster.
Can forests solve the problem of rising atmospheric CO2 levels? If lands are managed to optimize CO2 uptake through sustainable forestry practices, forests can continue to sequester a significant fraction of the carbon that human activities are adding to the atmosphere. However, this share is unlikely to grow much beyond its current level (about 10% of anthropogenic emissions) because the rate of carbon uptake levels off as forests mature. Forests can help, but are not a total solution. (For more details, see Unit 13, “Looking Forward: Our Global Experiment.”)
9. Feedbacks in the Atmosphere
Unit 2 // Section 9
Understanding how rising GHG levels may affect Earth’s energy balance is complicated because of feedbacks in Earth’s climate system. Feedbacks are interactions between climate variables such as temperature, precipitation, and vegetation and elements that control the greenhouse effect, such as clouds and albedo. Positive feedbacks amplify temperature change by making the greenhouse effect stronger or by reducing albedo, so they make the climate system more sensitive to the properties that trigger them. Negative feedbacks have a dampening effect on temperature change, making the climate system less sensitive to the factors that trigger them.
Feedbacks can be very complex processes and may take place over short or long time spans. Important feedbacks in Earth’s atmosphere include:
- Water vapor feedback (positive). The atmosphere can hold increasing amounts of water vapor as the temperature rises, because the pressure of water vapor in equilibrium with liquid water increases exponentially with temperature. The presence of more water vapor as temperature rises increases the greenhouse effect, as well as the absorption of solar radiation, which further raises temperature. This is the strongest and best-understood feedback mechanism in the atmosphere, because it is based on the straightforward fact that warm air can hold more water vapor than cool air.
- Cloud feedback on terrestrial radiation (positive). Because warmer temperatures increase water vapor amounts, they can increase cloudiness and further raise temperature. This is a very strong feedback that is not well understood. It is hard to know whether or how much cloudiness will increase as temperature does, because cloudiness depends more on upward air motion than on temperature or water vapor levels directly. (For details on how clouds form, see Section 5, “Vertical Motion in the Atmosphere.”)
- Cloud feedback on solar radiation (negative). As temperature increases and atmospheric water vapor levels rise, cloudiness may increase. Greater cloudiness raises Earth’s albedo, reflecting an increasing fraction of solar radiation back into space and decreasing temperature, although some cloud types are more reflective than others (Fig. 20). This is another very strong feedback that is not well understood because it is hard to know whether or how much cloudiness will increase with temperature. Also, as noted in the previous example, clouds can also absorb infrared radiation, raising temperatures.

Figure 20. Effects of cirrus and cumulus clouds on Earth’s energy balance
See larger image
Source: ©National Aeronautics and Space Administration. Earth Observatory.
- Vegetation feedback on solar radiation (negative). As temperatures rise, deserts may expand, increasing Earth’s albedo and decreasing temperature. This is a very complex feedback. It is uncertain whether deserts will expand, or conversely, whether higher CO2 levels might stimulate higher plant growth levels and increase vegetation instead of reducing it.
- Ice-albedo feedback on solar radiation (positive). Rising temperatures cause polar glaciers and floating ice sheets to recede, decreasing Earth’s albedo and raising temperatures. This feedback is very strong at times when polar ice has expanded widely, such as at the peak of ice ages. It can work in both directions, helping ice sheets to advance as Earth cools and accelerating the retreat of ice sheets during warming periods. There is relatively little polar ice on land today, so this feedback is not likely to play a major role in near-term climate change. However, temperature increases large enough to melt most or all of the floating ice in the Arctic could sharply accelerate global climate change, because ocean water absorbs almost all of the incident solar radiation whereas ice reflects most sunlight.
Feedbacks cause much of the uncertainty in today’s climate change models, and more research is needed to understand how these relationships work. A 2003 National Research Council study called for better measurement of many factors that affect climate feedbacks, including temperature, humidity, the distribution and properties of clouds, the extent of snow cover and sea ice, and atmospheric GHG concentrations (footnote 2).
10. Further Reading and Footnotes
UNIT 2 // SECTION 10
Further Reading
National Aeronautics and Space Administration, “The Importance of Understanding Clouds,” NASA Facts, FS-2005-0-073-GSFC, http://www.nasa.gov/pdf/135641main_clouds_trifold21.pdf.
Footnotes
-
- The Royal Society, Ocean Acidification Due to Increasing Atmospheric Carbon Dioxide, June 2005, p. vi, http://www.royalsoc.ac.uk/displaypagedoc.asp?id=13539.
- National Research Council, Understanding Climate Change Feedbacks (Washington, DC: National Academy Press, 2003), p. 3.