Chemistry: Challenges and Solutions
The Behavior of Atoms: Phases of Matter and the Properties of Gases
By documenting how particles behaved in different states of matter, 19th century scientists gained a deeper understanding of the atom. Avogadro's suggestion that a volume of any gas, under equal temperature and pressure, contains the same number of particles, led to an understanding of the relationship between temperature and pressure and to the Ideal Gas Law. Today, a fourth state of matter, the supercritical fluid, may possibly help mitigate the impact of burning fossil fuels by storing carbon dioxide as a supercritical fluid within the Earth. Researchers are developing methods to pack hydrogen gas into carbon nanostructures for use as fuel in hydrogen-powered vehicles.
This program explores the phases of matter—solids, liquids, and gases—and how particles in a given phase interact with each other. Phase diagrams explain at what temperature and pressure a given substance will be in a solid, liquid, or gas phase. Practical problems, like how to safely store enough hydrogen gas to power an automobile, are solved by understanding the different behaviors of solids, liquids, and gases. Understanding the relationships between temperature, pressure, and volume eventually led to the Ideal Gas Law, which provides the platform for examining the conditions under which matter can form a supercritical fluid. Researchers are investigating underground sequestration of supercritical carbon dioxide to mitigate the environmental impact of burning fossil fuels.
Hosted by Mala Radhakrishnan.
Unit Overview
 Fundamentally, chemistry is the science of interacting particles. This unit covers the properties of solids, liquids, and gases in terms of the behavior of invisible particles of matter that interact at the atomic scale. Pressure, volume, temperature, and intermolecular forces are some of the variables that control these interactions and lead to the familiar macroscopic properties of matter. Developing a better understanding of the atomic model through experiments with gases, scientists discovered the Ideal Gas Law, developed phase diagrams, and learned about the properties of supercritical fluids. Today’s chemists are exploring new ways to control the interactions of atoms, with the goal of making better hydrogen-powered cars and new technologies for the long-term, underground storage of carbon dioxide to reduce greenhouse warming.
Section 1: Introduction
As chemistry evolved into a scientific discipline in the 17th and 18th centuries, scientists became increasingly skilled at analyzing and theorizing about the properties of matter in its various forms—solid, liquid, and gas—and understanding how a substance such as water could exist in multiple states. These states of matter are called “phases”, and the transition from one form to another is called a “phase change.”

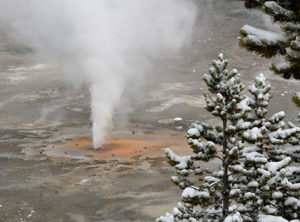
Figure 2-1. A Phase Change: Condensation
On a cold day, water vapor in warm indoor air condenses back to liquid when it touches a cold windowpane.
© Wikimedia Commons. Creative Commons License 3.0. Author: Danielclauzier, 2008.
Phase changes are physical, not chemical—the substance’s form is altered, but its chemical composition remains constant. Water is always H2O, whether it is liquid, frozen, or vapor. In contrast, reactions are chemical changes: Bonds are formed or broken, and the final products are different substances from the inputs used to produce the reaction. With an understanding of phase changes, we can answer many questions about everyday phenomena. For example, why do cooks need to alter recipes for baking at high altitudes? Why do some liquids give off fumes when they are left in open containers at room temperature? And why does water vapor condense on windowpanes on cold days? (Figure 2-1)
Chemical phases are characterized by two features: the distance between individual particles of the material and the level of energy (temperature) in the system. This means that to understand phases and phase changes, chemists had to develop accurate tools and scales for measuring temperature. They also had to understand and quantify the role of pressure, which is especially important in gas chemistry. (See Section 5 of this unit.)
The modern study of gases did not begin until the 1600s after chemists had been working with solids and liquids for centuries. This sequence is not surprising. Many gases were invisible, which made them difficult to measure. Moreover, according to the widely supported idea proposed centuries earlier by Aristotle that all matter was made up of four elements (fire, earth, air, and water), the air was a unique and indivisible element. Scientists who viewed the world this way thought that the various gases present in the air were different kinds of air, not unique substances with their own properties. Once this idea was disproved, however, pneumatic (gas) chemistry progressed rapidly.
By the mid-19th century, scientists had formulated a series of laws that explained how temperature and pressure combined to affect the behavior of gases under different conditions. With this knowledge, they were ready to quantify and analyze phase changes in various substances. The first version of a phase diagram, showing the full range of states for a chemical, was developed in 1897. Today, phase diagrams are standard tools in fields such as physical chemistry, geology, and materials science. (Phase diagrams will be discussed again in Section 7.)
Section 2: Key Variables
The main phases of matter—solid, liquid, and gas—have unique characteristics that are common across all materials:
- In the solid phase, individual particles of the material (atoms of an element, molecules of a compound) are bound densely together in fixed positions by strong attractive forces, so that the solid holds its shape. (We will look at the forces between molecules in detail in Unit 5.)
- In the liquid phase, attractive forces are weaker, so particles of the material can slide past one another. Liquids assume the shape of the container that holds them but do not expand to fill the entire volume of the container.
- In the gas phase, attractive forces are extremely weak, so particles are widely separated. Gases will completely fill the shape and volume of a container. (Figure 2-2)
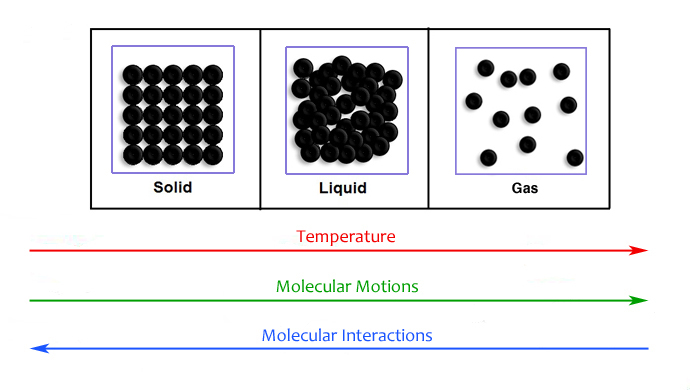
Figure 2-2. Phases of Matter
This schematic diagram shows the differences in physical properties and particle arrangement between a substance in the solid, liquid, and gas phases. In a solid, the particles are packed in a rigid configuration, giving the substance a definite shape and size. In a liquid, the particles are close together but may move with respect to one another, giving the substance a definite volume but a fluid shape. In a gas, the particles may occupy the entire volume of the container, so that their shape and volume are both defined by the container.
© Science Media Group.
The particles of any substances are constantly in motion, but their energy levels vary. Particles of gases have much greater kinetic energy (energy of motion) than those of liquids, which in turn have more energy than solids. Heating materials will increase their kinetic energy. If enough energy is added to a substance, the particles will overcome their attractive forces and the material will change to a less ordered state: A solid will melt into a liquid, or a liquid will evaporate into a gas. When materials cool, they lose kinetic energy: Gases condense into liquids, and liquids freeze into solids (Figure 2-3). Materials also can change from a solid directly into a gas, a process called “sublimation,” or from a gas to a solid, which is called deposition.
To see phase changes happening around us every day, we can simply look outdoors at Earth’s water cycle. Water constantly cycles between land, oceans, and the atmosphere, changing between solid, liquid, and gas forms (Figure 2-3). When water vapor in the air cools, it condenses back into droplets and falls as rain (or freezes and falls as snow). The same process that produces clouds in the atmosphere is also what makes water condense on a cold surface, such as a windowpane, the outside of a cold glass, or eyeglass lenses when the wearer moves from outdoors into a warm room.
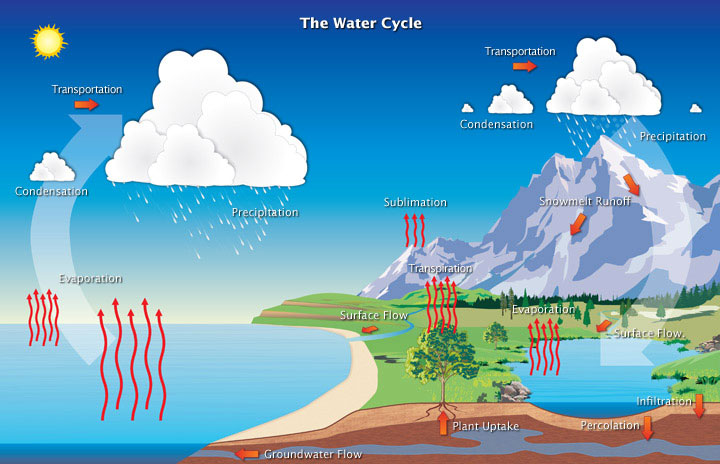
Figure 2-3. The Water Cycle
Water is constantly cycling between solid, liquid, and gas phases on Earth and in the atmosphere.
© NASA, Earth Observatory.
Pressure is a measurement of force pushing on an area. It affects phase changes by reinforcing the attractive forces that hold particles together. As we will see in Section 4 of this unit, scientists have measured pressure in many different units. Today, one of the most common units, especially for nontechnical discussions, is pounds per square inch (psi). We are constantly under pressure from Earth’s atmosphere, which has weight and presses down on us and on the objects around us. When we stand at sea level, this pressure measures 14.7 psi, so this figure is referred to as normal atmospheric pressure.
Under normal atmospheric pressure, water freezes at 0°C and boils at 100°C. However, compressing water under high pressure makes it harder to push the molecules apart. More heat is required to make it boil under high pressure than under normal atmospheric pressure, so the boiling point rises. Conversely, under low pressure, less energy is required to cause a phase change, because there is less force holding the molecules together.
Although we may not feel the change, atmospheric pressure decreases with altitude, because as we ascend above sea level, less of the atmosphere is pressing down on us from above. Foods cook more quickly at high altitudes than they do at sea level because water in the food boils at a lower temperature than it would at normal pressure. In a pressure cooker, foods that normally take hours to cook will be ready to eat in a fraction of the time, because the high pressure inside makes water boil at a higher temperature than it would under normal atmospheric pressure, and this high heat reduces cooking time.
Section 3: Measuring Temperature
Before chemists could analyze phase changes, they had to be able to measure temperature accurately. Although early scientists did not realize it, temperature is a measure of the average kinetic energy of the molecules in a substance, so it is directly related to states of matter.
In 1597, Italian physicist Galileo Galilei (1564–1642) demonstrated the idea that water in a tube could be used to measure temperature because the water expanded when heated and contracted when cooled. However, the device Galileo created was a “thermoscope,” not a thermometer: It did not have a temperature scale, so it simply registered that the amount of heat was changing. Over the next century, other European scientists built enclosed glass thermometers that contained alcohol (which has a lower freezing point than water) or oil to measure temperature, but none were widely adopted. Moreover, without a fixed temperature scale, no two scientists’ measurements were directly comparable.

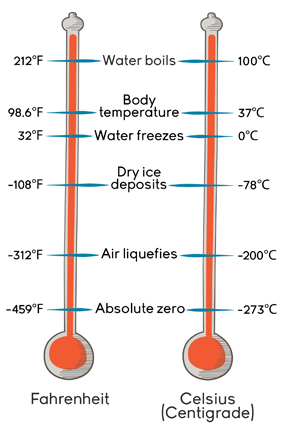
Figure 2-4. Fahrenheit and Celsius Temperature Scales
The Fahrenheit and Celsius scales both measure temperature scales, but one degree Celsius represents a larger increment of heat than one Fahrenheit degree.
© Science Media Group.
In 1724, Dutch-German physicist Daniel Fahrenheit (1686–1736) created the temperature scale that bears his name, using a mercury thermometer that he had developed a decade earlier. Fahrenheit set zero at the temperature of a mixture of ice, water, and salt (adding salt lowers the freezing point of water)—the coldest condition he could produce. The next point, 32°F, was the temperature at which ice began to form on the surface of cold water. Fahrenheit’s third fixed point was the body temperature of a healthy adult male, which he initially measured at 96°F and later corrected to 98.6°F. From these points, other scientists calculated the boiling point of water to be 212°F.
Swedish astronomer Anders Celsius (1701–1744) created another new scale in 1742 that set the freezing point of water at 0° and the boiling point at 100°. He called the scale “Centigrade,” reflecting that it was based on a 1-to-100 scale; the system was renamed Celsius in his honor after his death. The Fahrenheit and Celsius scales are equal at -40° but diverge from that point, since each one-degree increase Celsius represents a much larger increment of temperature than one degree Fahrenheit. (Figure 2-4)

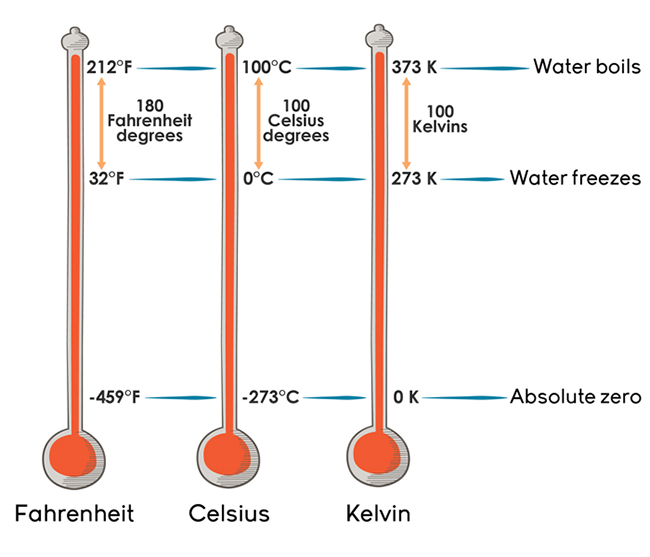
Figure 2-5. Fahrenheit, Celsius and Kelvin Scales
Unlike the Fahrenheit and Celsius scales, the Kelvin scale was developed starting from absolute zero, so it does not have negative values.
© Science Media Group.
In 1854, William Thomson, 1st Baron Kelvin, an Irish-Scottish physicist (1824-1907), produced yet another temperature scale that was intended to be more useful than the Fahrenheit or Celsius scales. In Thomson’s “absolute” scale, every increase from one degree to the next represented an equivalent amount of energy. The only fixed reference point on the scale was absolute zero, which represented the temperature where no kinetic energy remained in any substance — that is, the temperature where everything was frozen. This was an abstract concept at that time. Thomson knew from work by early gas chemists that the volume of a gas at constant pressure was directly proportional to its temperature, and he used this linear relationship to calculate the temperature where pressure would equal zero.
This value, -273°C, represents absolute zero, or 0 on the Kelvin scale—so named because Thomson received the title of 1st Baron Kelvin in 1892. Today, the Kelvin scale is widely used by scientists, who consider it more useful than other systems because it is based on an absolute value. When a substance’s temperature is measured in Kelvins, its value is directly proportional to the average kinetic energy of the molecules of the substance. And since the Kelvin scale starts at absolute zero, it does not require the use of negative numbers, which simplifies calculations. (Figure 2-5)
Section 4: Measuring Pressure
Pressure is a simple concept: It measures the amount of force that is pushing in a given direction on a defined area (typically shortened to “force-per-unit-area”). However, scientists have developed many different methods and units for measuring pressure. The unit that is most widely recognized internationally for measuring pressure is the pascal (Pa), a metric unit named after French mathematician and philosopher Blaise Pascal (1623–1662). One pascal is equal to one newton per square meter, which is a very small unit. As discussed above, standard air pressure (the weight of the atmosphere on us at sea level) is 14.7 pounds per square inch, which is equivalent to 101,325 pascals. Because this number is so large and difficult to work with, measurements are often listed in hectopascals (1 hPa = 100 Pa) or kilopascals (1 kPa = 1,000 Pa) for ease of use.
Other common units of pressure include:
- The “millibar,” which was introduced by British meteorologist William Napier Shaw (1854–1945) in 1909 and is used for measuring air pressure at Earth’s surface in weather maps. “Bar” derives from the Greek word baros, which means weight. One bar is approximately equivalent to normal atmospheric pressure, and one millibar is 1/1000th of a bar. A millibar is also equal to one “hectopascal,” and the term hectopascal is gradually replacing millibar in international usage.
- “Inches of mercury,” another unit widely used by meteorologists, refers to the height of a column of mercury in a barometer, measured in hundredths of inches. Standard air pressure at sea level is 29.92 inches of mercury, and weather barometer scales usually range between about 28 and 31 inches. High or rising pressure is associated with fair weather, and low or falling pressure typically is a sign of approaching rain or storms.
- The “torr” is named after Italian physicist Evangelista Torricelli, the inventor of the barometer. One torr is equivalent to the pressure exerted by one millimeter of mercury.
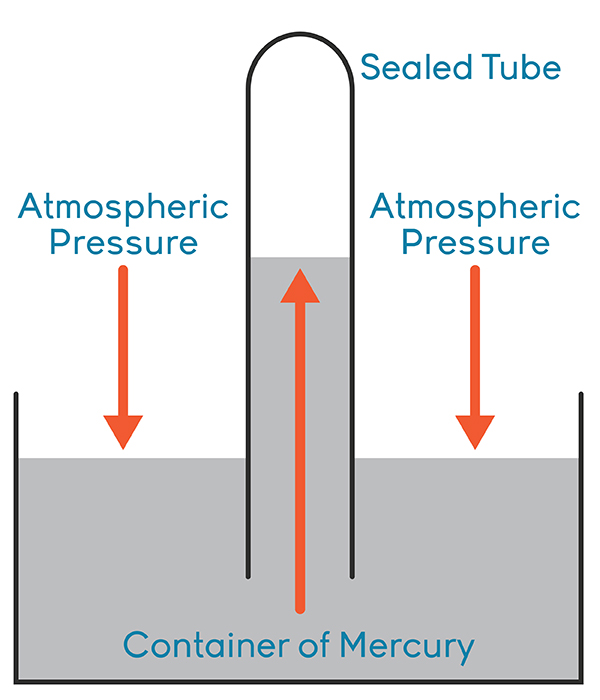
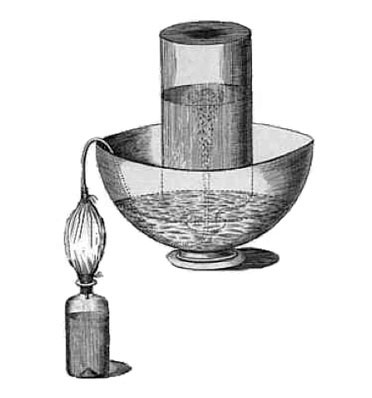
Torricelli and the Invention of the Barometer
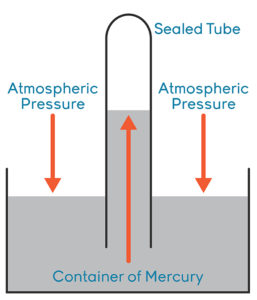
Torricelli’s Mercury Barometer Concept. © Science Media Group.
Italian physicist and mathematician, Evangelista Torricelli (1608–1647) first tried constructing a barometer that used water to measure pressure. He filled a 60-foot-long glass tube with a closed bulb at one end with water and inverted the tube into a basin filled with more water. The top of the water column fell slightly, but it did not drain completely and flow over the sides of the basin. This showed, in Torricelli’s view, that the atmospheric pressure was pushing down on the open surface of the water in the basin, which forced (or kept) the water up in the tube.

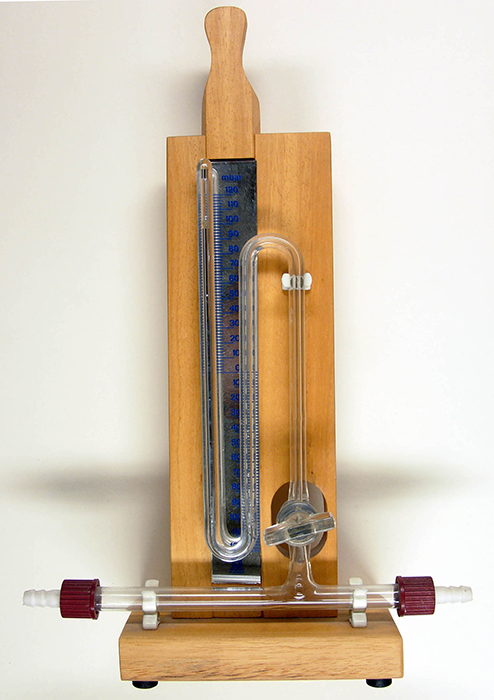
Modern Mercury Barometer. © Wikimedia Commons, Public Domain.
Since the scale of this experiment was cumbersome (especially for the 1600s), Torricelli carried it out again using mercury, which is liquid at room temperature and about 13 times denser than water, so he could show the same effects with a smaller quantity of it.
When Torricelli filled a tube about 35 inches long with mercury and inverted it into a basin filled with more mercury, the top of the mercury column fell to about 30 inches and then remained steady. Over time, it could be seen to rise and fall slightly, in response to changes in temperature and what we now know were changes in atmospheric pressure.
As inventors refined barometers, they added scales to mark the rise and fall of mercury, which is why weather reports still describe barometric pressure in terms such as “30 inches and falling.” Manufacturers also reduced the size of mercury barometers by doubling the mercury tube back on itself so that it only had to be half as long as Torricelli’s version.
Section 5: Early Gas Chemistry—Studying the Air
Anglo-Irish chemist Robert Boyle (1627–1691) was one of the first scientists to think about air in an analytical way. Boyle practiced both alchemy (discussed in Unit 1) and scientific chemistry, although he distinguished between these fields. He conducted wide-ranging experiments analyzing the contents of metals and other common substances, but is best known for his first major investigation, which focused on what he called “the spring and weight of the air.”
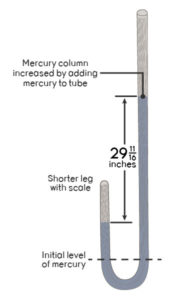
Figure 2-6. Boyle’s Gas Apparatus
By adding mercury to the open end of a J-tube, Boyle increased pressure on air trapped at the closed end of the tube.
© Science Media Group.
Using a pneumatic pump and curved glass tubes with air trapped inside, Boyle observed that gases were elastic and could be compressed or expanded. Boyle saw that when he added mercury to the open end of a tube, the volume of air at the sealed end was compressed: This new weight of mercury in the tube pushed on that volume of air, thereby increasing the pressure on that pocket of air. The product of the pressure exerted by mercury times the volume of air at the end of the tube remained constant: Increasing the pressure reduced the volume, and vice versa (Figure 2-6). In 1662, Boyle published data showing what became known as “Boyle’s Law”: At a constant temperature, the product of pressure on a gas and the volume of the gas is constant. This is a great achievement because it was the first time a mathematical physical law was applied to gases. It would take more than a century for anyone to discover a new gas law.
In the 18th century, chemists started to investigate ways of generating and separating various gases, although they thought these substances were different types of air, not unique chemicals. Joseph Black, a Scottish scientist (1728–1799), was searching for a cure for kidney stones when he heated magnesium carbonate and limestone in separate experiments, each time producing a distinctive gas that was not respirable and that would extinguish flames. Black named this gas (which was actually carbon dioxide) “fixed air,” recognizing that it had different properties from breathable air. In other experiments, he showed that the same gas was produced whether he burned charcoal, fermented fruits, or looked at what animals exhaled.

Figure 2-7. Priestley’s Equipment for Carbonating Water
Joseph Priestley treated water with “fixed air” (carbon dioxide) to create carbonated water—the basis for the soft drink industry.
© Public Domain.
English chemist Joseph Priestley (1733–1804), whose support for phlogiston theory was discussed in Unit 1, made many important advances in gas chemistry. Priestley moved next door to a brewery in 1767 and began experimenting with fixed air after he noticed that it was produced by fermenting beer. For centuries Europeans had believed that naturally sparkling mineral waters from sources like San Pellegrino and Vergeze (the source of Perrier water) could promote or restore health. Priestley sought to mimic these sources by bubbling fixed air through water, inventing a process that would eventually spawn the soft drink industry. He recorded instructions for “Impregnating Water With Fixed Air,” describing it as an easy process of “first filling any vessel with water, and introducing the fixed air to it, while it stands inverted in another vessel of water.” Putting the mixture in an inverted vessel over water kept atmospheric air from mixing with the carbonated water during the experiment. (Figure 2-7)
Priestley also is credited with isolating numerous gases, including nitric oxide (NO), which he called “nitric air”; nitrogen dioxide (NO2), or “red nitrous vapour”; ammonia (NH3), or “alkaline air”; and sulfur dioxide (SO2), or “vitriolic acid air.”
Another English chemist, Henry Cavendish (1731–1810), isolated hydrogen in 1766. Cavendish produced hydrogen, which he called “inflammable air,” by reacting zinc and other metals with acids. Cavendish also observed that burning hydrogen in the laboratory produced water, and determined that water was composed of two parts hydrogen to one part oxygen. This insight disproved Aristotle’s idea that water was an element since it could be both created and disaggregated into its components in the laboratory. Antoine Lavoisier (discussed in Unit 1) ultimately gave hydrogen its chemical name, from the Greek words hydro and genes, meaning “water forming.”
Section 6: Formulating the Gas Laws
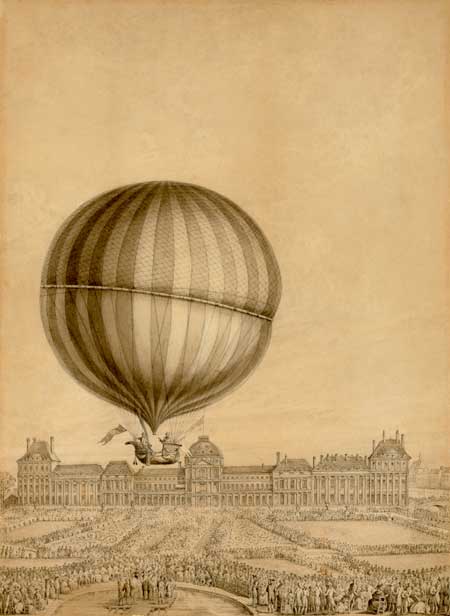
From the late 1700s through 1850, gas chemistry made rapid advances. In France, a craze for ballooning developed in the 1780s as scientists and inventors explored ways to rise into the sky powered by various gases or just by hot, expanding air (Figure 2-8). Jacques-Alexandre-César Charles (1746–1823), a wealthy Parisian, created the first hydrogen balloon, which he filled by pouring hydrochloric acid over a barrel of iron filings to generate large quantities of hydrogen gas. The filled balloon shot straight upward on takeoff (unmanned) in Paris, drifted about 15 miles north, and came down in a village, where peasants attacked the startling object with pitchforks.1

Figure 2-8. Inflation of the First Hydrogen Balloon, the Charliere, 1783
Early balloons were powered with hydrogen, which provided lift because hydrogen gas is lighter than the air surrounding the balloon.
© Library of Congress, Prints & Photographs Division, Tissandier Collection, LC-DIG-ppmsca-02284.
Charles’ unpublished observations about balloons filled with different types of gases caught the interest of Joseph Gay-Lussac (1778–1850), who also made numerous balloon ascents in the course of his research, some to altitudes of above 4 miles. In 1802, Gay-Lussac published a finding that came to be called “Charles’ Law” because it referenced work by Charles. The law stated that if the pressure and quantity of a gas are held constant, its volume is directly proportional to its temperature: Temperature and volume will increase together or decrease together. This holds true for all gases: Equal volumes of all gases expand equally with the same increase in temperature. Charles’ Law explains why a football that is inflated indoors will shrink slightly if it is taken outside on a cold day: As the temperature of the air inside the football decreases, its volume also decreases.
Gay-Lussac also formulated a law, later named for him, stating that gases combine among themselves in simple, whole-number proportions by volume. For example, hydrogen and oxygen combine in a 2:1 ratio by volume to make water and ammonia is composed of nitrogen and hydrogen in a 1:3 ratio. This was similar to Dalton’s Law of Multiple Proportions, although Dalton measured the ratios of weights when elements combined, not their volumes.
In 1811, Italian chemist Amedeo Avogadro (1776–1856) offered a hypothesis that aligned Dalton’s Law of Multiple Proportions with Gay-Lussac’s Law of Combining Volumes. Avogadro proposed that equal volumes of gases under constant temperature and pressure contained the same number of particles, regardless of what types of gases they were. As a result, combining these gases by volumes in ratios of small whole numbers also would mean that their particles combined in ratios of small whole numbers. Avogadro’s theory was largely ignored for some 50 years. By the late 1850s, however, it had gained acceptance and helped chemists to determine atomic and molecular weights.
According to Avogadro’s theory, since the volume of a gas and the number of particles it contains are constant at a constant temperature and pressure, adding more particles will produce an increase in volume. This relationship is what makes guns fire: Combustion of gunpowder generates a gas that propels the shell out of the chamber. Similarly, passenger car airbags inflate when the car’s safety system records an abrupt deceleration (that is, a collision). The system ignites a pellet filled with sodium azide (NaN3) and potassium nitrate (KNO3), which react together and generate a large quantity of nitrogen gas. The gas inflates an airbag to cushion a passenger against the impact of the collision. Vehicle airbags inflate in less than 1/20th of a second. (Figure 2-9)
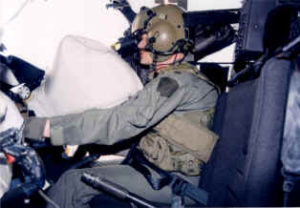
Figure 2-9. Deployment of Cockpit Airbag
Vehicle airbags inflate when a chemical reaction quickly generates a large quantity of nitrogen gas.
© Wikimedia Commons, Public Domain.
These gas laws are all based on holding constant some key variables (pressure, volume, temperature, number of particles) and seeing how others are affected. The relationships identified by Boyle, Charles, and Gay-Lussac can be combined into a relationship called the “Ideal Gas Law,” which summarizes the roles of pressure (P), volume (V), and temperature (T) in determining the state of an amount of a gas, and can be summarized thus:
PV = nRT
where n represents the number of particles of the gas and R is the “Universal Gas Constant.” This constant is a number that never changes, appears throughout the field of chemistry, and was first discovered as part of the Ideal Gas Law.
The Ideal Gas Law is a simple model of the behavior of gases, and it accurately describes how most common gases behave within the temperature ranges at which we live. In the language of chemistry, an ideal gas (that is, one for which the ideal gas equation was always true) would be a substance whose particles have no attraction to one another, so they would never stick together and condense into a liquid even under extreme pressure. And the particles of an ideal gas would not take up any space. This means that at 0 K (absolute zero), an ideal gas would have zero volume.
However, we know by definition that matter has mass and takes up space. In reality, all gas molecules have measurable volume, and their molecules will be attracted to one another if they are put under enough pressure—that is, they will liquefy. But some gases come close to being ideal. For example, helium has very small atoms with weak attractive forces, so it has to be cooled to extremely low temperatures to liquefy (4 K, or -452°F).
1 Jane E. Boyd, “Artificial Clouds and Inflammable Air: The Science and Spectacle of the First Balloon Fights, 1783,” Chemical Heritage Magazine, Summer 2009.
Section 7: Picturing Material Behavior with Phase Diagrams
Once the gas laws were formulated, chemists could analyze how materials transitioned from one phase to another, and how temperature and pressure affected these changes. In 1897, a British metallurgist named Sir William Chandler Roberts-Austen (1843–1902) produced what is widely regarded as an early form of a now-common tool in chemistry and related disciplines: the phase diagram. Roberts-Austen and other English scientists were analyzing the properties of “wootz steel,” a metal that had been produced in India for centuries and was prized for making extremely sharp and durable weapons.2 His diagram showed how the composition of iron changed as it was heated. (Figure 2-10)
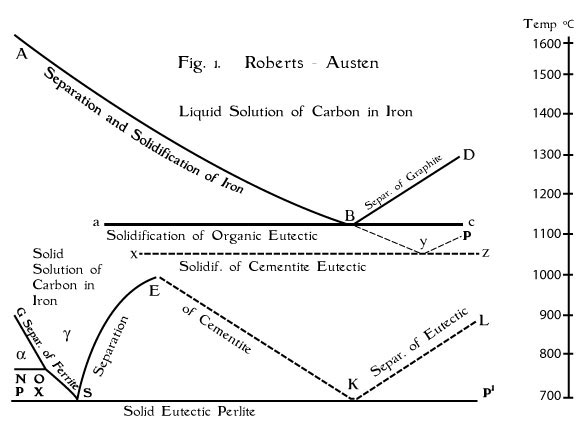
Figure 2-10. Roberts-Austen Iron-Carbon Phase Diagram
The Roberts-Austen Iron-Carbon phase diagram has been called “the first phase diagram.” It shows how changes in pressure and temperature transform the composition of a solution of carbon in iron.
© Published by Roberts-Austen in 1899. Redrawn by Science Media Group.
Modern phase diagrams show relationships between different states of matter under various combinations of temperature and pressure. As we saw in Section 2, a substance can exist in two different states at once—for example, as a liquid and a gas, with molecules cycling from one state to the other. It is also possible for a material to be both solid and liquid, with both melting and freezing taking place at its edges, or to exist as a solid and a gas. Phase diagrams show what forms a substance will take under given temperatures and pressure levels, and where these equilibrium lines (when equal numbers of molecules are changing form in both directions) are located. (Figure 2-11)
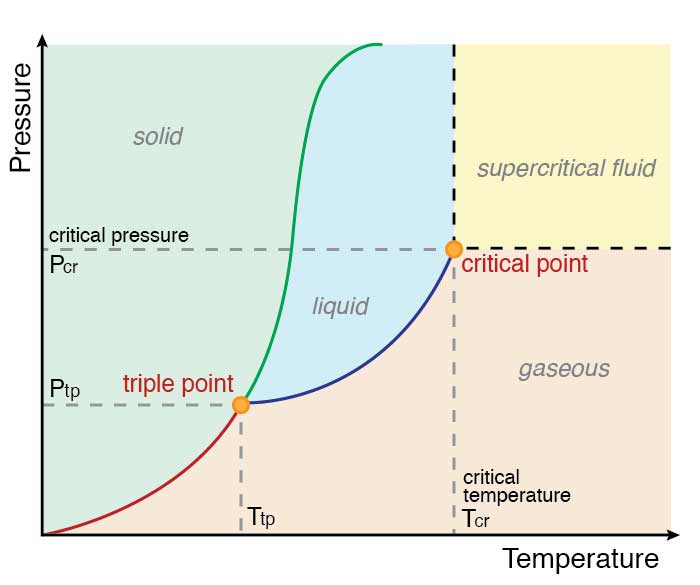
Figure 2-11. Phase Diagram for Water
An unusual feature of the water phase diagram is that the solid–liquid phase line (illustrated by the green line) has a negative slope.
© Science Media Group.
Important parts of the phase diagram in Figure 2-11 include:
- The triple point: the combination of temperature and pressure where the substance’s three major phases—solid, liquid, and gas—are at equilibrium. At the triple point, the substance can exist in all three states at once. At any point on the graph that is not on a line, the substance exists in only one phase.
- The critical point: the combination of temperature and pressure at which the liquid and gas phases become indistinguishable. When temperatures are above the critical temperature and pressure is above the critical pressure, the substance becomes a super-critical fluid.
- The blue line from the triple point to the critical point is the substance’s vapor pressure curve, where its liquid and gas forms are in equilibrium. The point along this curve where pressure equals 1 atmosphere is the substance’s normal boiling point.
- The green line from the triple point upward is the substance’s freezing/melting curve, where its solid and liquid forms are in equilibrium. The point along this curve where pressure equals 1 atmosphere is the substance’s normal freezing/melting point.
- The red line from the triple point downward is the equilibrium between the substance’s solid and gas phases. At points along this curve, the material will sublimate directly from solid to gas or deposit from gas to solid.
Phase diagrams can provide many insights into how substances behave, as we will see in Sections 8 and 9, which examine the phase diagrams for water and carbon dioxide, respectively. Scientists use phase diagrams to organize data, analyze the composition of materials, and make predictions about when a phase change may occur in a substance or mixture of substances. For example, metallurgists may want to know how an alloy will perform under certain conditions. Geologists use phase diagrams to analyze how oil and gas deposits form underground and predict how long a formation may produce recoverable resources.
2 S. Ranganathan and Sharada Arinivasan, “A Tale of Wootz Steel,” Resonance: Journal of Science Education, Indian Academy of Sciences, June 2006, http://www.ias.ac.in/resonance/june2006/ranganathan-pdf/p67–77.pdf.
Section 8: Example 1 — A Phase Diagram for Water
The phase diagram for water illustrates some of water’s special properties, such as the fact that it is less dense as a solid than in its liquid form. Water also has a relatively high boiling point—100°C at normal atmospheric pressure, which is higher than many common fluids, such as gasoline and alcohols. (Figure 2-12)
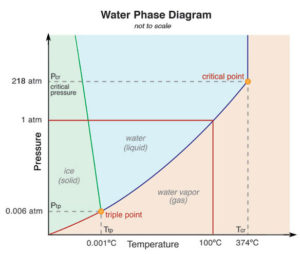
Figure 2-12. Phase Diagram for Water
An unusual feature of the water phase diagram is that the solid–liquid phase line (illustrated by the green line) has a negative slope. (Unit 2, Section 8)
© Science Media Group.
For most substances, the line that separates the solid and liquid phases slopes upward to the right, indicating that the solid form is denser than the liquid. However, in Figure 2-12, it slopes to the left. Because water has this property, we can see by moving up the curve that it is possible to melt ice simply by adding pressure (which favors the formation of a denser phase—in this case, liquid water) without adding any heat. This condition is what makes ice skating work: The blade of a skate puts pressure on the surface of the ice, melting a small fraction of it and creating a film of water on which the skater can glide.
As we can see from the line indicating where pressure is 1 atmosphere (atm), water’s normal boiling point (the intersection with the vapor pressure curve) is 100°C, and its normal freezing point (the intersection with the freezing/melting curve) is 0°C. The triple point occurs at 0.006 atm and 0.01°C. This is the minimum pressure at which liquid water can exist; below this point, solid ice will sublimate when heated, and water vapor will deposit directly as a solid.
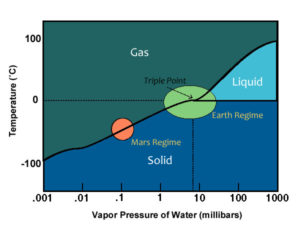
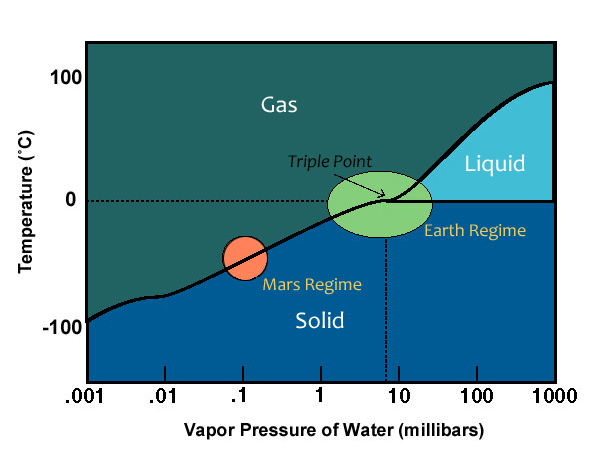
Figure 2-13. Phase Diagram for Water on Earth and Mars
A phase diagram shows that water exists in different forms on Earth and Mars.
© NASA.
Water’s critical point occurs at 374°C and 218 atm. Beyond this point, liquid water and water vapor are indistinguishable: The solution fills the container like a gas but can dissolve substances like a liquid. This substance is referred to as “supercritical water,” and has some important industrial applications. For example, supercritical water oxidation is a process for destroying hazardous wastes by combusting them with oxygen or another oxidant, using supercritical water as the reaction medium. Supercritical water also is used to moderate and cool a proposed next-generation nuclear power reactor called the “Supercritical-Water-Cooled Reactor”; one advantage is that it does not change phases inside the reactor, which reduces stress on the system.3
Scientists can use a water phase diagram to predict where water may be found, or where it was present in the past. Figure 2-13 is a phase diagram for water that highlights average temperature and pressure ranges on Earth and Mars (note that temperature and pressure are plotted on opposite axes from the diagrams in Figures 2-10, 2-11, and 2-12). As the diagram shows, conditions on Mars are below the triple point, so under these conditions water only can exist on Mars as a solid or a gas.
3 For details see http://www.gen-4.org/Technology/systems/scwr.htm.
Section 9: Example 2 — A Phase Diagram for Carbon Dioxide
Both water and carbon dioxide are ubiquitous on Earth, and their phase diagrams have a similar shape. However, comparing the CO2 phase diagram in Figure 2-14 to its counterpart for water in Figure 2-12 highlights some important differences between these two substances.
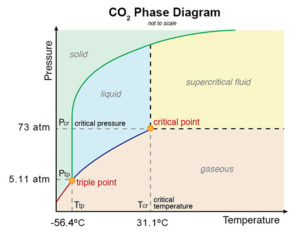
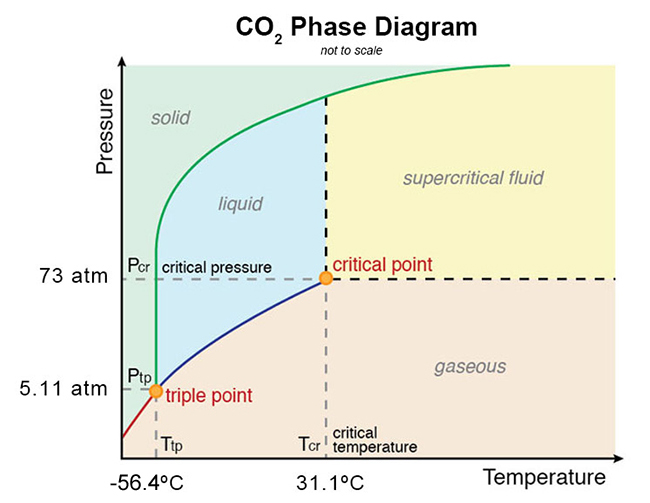
Figure 2-14. Phase Diagram for Carbon Dioxide (CO2)
The triple point of carbon dioxide occure at a pressure of 5.11 atm and -56.4°C. At temperature of -78°C, the vapor pressure of solid carbon dioxide is 1 atm. At this pressure, the liquid phase is not stable, the solid simply sublimates. Thus solid carbon dioxide is called dry ice, because it does not go through a liquid state in its phase transition at room pressure.
© Science Media Group.
Unlike water, CO2‘s melting point increases with increasing pressure. However, another important difference between these two substances is that CO2 cannot exist as a liquid under normal atmospheric conditions because its triple point occurs at -56.4°C and 5.11 atm, which is well above normal atmospheric pressure. At any temperature above -78°C, CO2 will sublime into a gas. Solid CO2 is called “dry ice” because it sublimes directly to a gas under normal atmospheric conditions instead of melting into a liquid. This property makes it a useful coolant since it does not add water to substances that it is chilling.
The critical point for CO2 occurs at 73 atm and 31.1°C. Supercritical carbon dioxide is widely used as a solvent for industrial extraction processes because it has a very low viscosity; so it flows easily and can penetrate extremely small spaces. It is widely used for decaffeinating coffee: When forced through green coffee beans, it penetrates deeply into the beans, dissolving and removing most of their caffeine content. Other uses for supercritical CO2 include as a dry cleaning solvent and a natural refrigerant.
Section 10: Conclusion
Throughout the 19th century, as basic knowledge about the properties of matter expanded, chemistry enabled many advances that were central to the Industrial Revolution. For example, large-scale production of soap, bleaches, and synthetic dyes helped spur the growth of the textile industry. Steel replaced iron as the material of choice for machines and building construction once metallurgists found ways to manufacture high-quality alloys quickly and cheaply. Synthetic fertilizer production revolutionized agriculture, and materials like rubber and early plastics became key building blocks for many durable and consumer goods.
However, chemists were on the verge of another wave of advances: looking inside the atom itself to learn how its components worked, and whether the atom was divisible. These studies would expand the periodic table and lay the groundwork for nuclear chemistry.
Section 11: Further Reading
Pawley, Emily. “Powerful Effervescence.” Chemical Heritage Magazine 26 (2008). http://www.chemheritage.org/discover/media/magazine/articles/26-2-powerful-effervescence.aspx.
Boyd, Jane E. “Artificial Clouds and Inflammable Air: The Science and Spectacle of the First Balloon Flights, 1783.” Chemical Heritage Magazine 27 (2009). http://www.chemheritage.org/discover/media/magazine/articles/27-2-artificial-clouds-and-inflammable-air.aspx.
National Science Resource Center. “The Water Cycle: From the Sky to the Land and Back Again.” Properties of Matter, Lesson 7. http://www.propertiesofmatter.si.edu/Water_Cycle.html.
Schachtman, Tom. Absolute Zero and the Conquest of Cold. New York: Houghton Mifflin, 1999.
Glossary
- Atmospheric pressure
- The force exerted by the weight of the atmosphere on a given unit area. Atmospheric pressure on Earth at sea level is 14.7 pounds per square inch (psi), 760 torr or 1 atm.
- Critical point
- The combination of temperature and pressure beyond which a gas becomes a supercritical fluid.
- Deposition
- A process by which matter can turn from a gas directly into a solid.
- Directly proportional
- Occurs if, as the value of one variable increases, the value of another variable increases at the same rate.
- Gas
- A low-density phase of matter that has no shape or volume, and will fill the entire volume of a container.
- Liquid
- A phase of matter that has a distinct volume but no shape.
- Newton
- The absolute unit of force in the International System of Units (SI units). The newton is defined as the force necessary to provide a mass of one kilogram with an acceleration of one meter per second. It was named for Sir Isaac Newton (1642–1727), the British physicist, whose Second Law of Motion describes the changes that a force can produce in the motion of a body.
- Phase change
- The conversion of a substance from one state to another. Phase changes include melting (solid to liquid), freezing (liquid to solid), vaporization (liquid to gas), condensation (gas to liquid), sublimation (solid to gas), and deposition (gas to solid).
- Solid
- A phase of matter that has a distinct volume and shape.
- Triple point
- The combination of temperature and pressure at which a substance can exist as a solid, a liquid, and a gas simultaneously.