Private: Learning Math: Data Analysis, Statistics, and Probability
Describing Distributions Part C: Relative and Cumulative Frequencies (30 minutes)
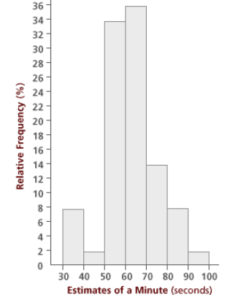
The frequency histogram and grouped frequency table for the 52 time estimates contain similar information to the stem and leaf plot, but they don’t indicate each person’s actual estimate. The height of each bar in the histogram indicates the frequency of the corresponding interval of estimates on the horizontal axis. See Note 4 below.
As with the stem and leaf plot, the frequency histogram can be an awkward graph for large data sets, since the vertical axis corresponds to the frequency of each interval of values. For large data sets, some intervals may have many values and a high frequency. Consequently, the vertical axis would have to be scaled according to the largest frequency.
An alternative is to use relative frequencies to describe how many values are in each interval relative to the total number of values. For most purposes, relative frequencies are more useful than absolute frequencies; for example, the statement “17 of the 52 estimates are in the interval 50 to < 60” is more useful than the statement “17 estimates are in the interval 50 to < 60.”
The relative frequency for the interval 50 to < 60 is 17/52, which you can also write in decimal form as .327 (rounded to three digits). Multiplying by 100 gives you the percentage, 32.7%. This means that 32.7% of the estimates are in the interval 50 to < 60.
Here is what you get for the rest of the data:
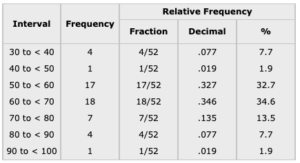
Notice that the relative frequencies expressed as fractions and decimals add up to 1 and that the percentages add up to 100%.
Problem C1
Use only the relative frequencies from the table to answer the questions below. Give your answers as percentages, to the nearest 10th of a percent, or explain why the answer cannot be found from the table.
a. What percentage of the responses are in the 70s and below?
b. What percentage of the responses are 80 or higher?
c. What percentage of the responses are in the 50s and below?
d. What percentage of the responses are 60 or higher?
e. What percentage of the responses are less than 100?
f. What percentage of the responses are at least 40 but below 70?
g. What percentage of the responses are 65 or greater?
h. What percentage of the responses are less than 35?
i. What percentage of the responses are equal to 60?
![]() To determine whether a question can be answered, decide whether you have all the information you would need to answer it.
To determine whether a question can be answered, decide whether you have all the information you would need to answer it.
TAKE IT FURTHER
Problem C2
For questions (g) and (h) in Problem C1, use the table to come up with an estimated percentage.
![]() One assumption you might make is that each interval is divided evenly. So if the interval states that 15.4% of the estimates are between 80 and 90, you might assume that half of these (7.7%) are between 80 and 85 and half are between 85 and 90.
One assumption you might make is that each interval is divided evenly. So if the interval states that 15.4% of the estimates are between 80 and 90, you might assume that half of these (7.7%) are between 80 and 85 and half are between 85 and 90.
The relative frequency histogram looks similar to the frequency histogram; the only differences are that the labels along the vertical axis represent percentages, and the height of each bar now represents the relative frequency expressed as a percentage (or proportion) for the corresponding interval of values.
In This Part: Cumulative Frequencies
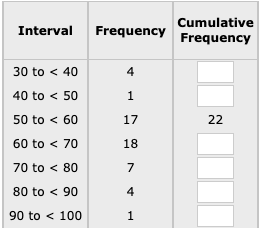
As in Session 2, we can determine cumulative frequencies for intervals of data. For example, the number of responses that are less than 60 is the cumulative frequency of 60. (Note that “below 60” means “in the 50s and below.”)
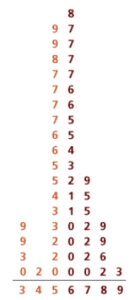
If you begin with the stem and leaf plot for the 52 estimates of a minute, the 22 values in the lighter color are the estimates below 60:
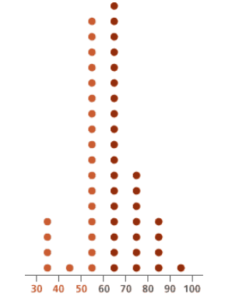
The corresponding 22 dots are shown in the dot version of this stem and leaf plot:
And finally, the corresponding bars in the frequency histogram are shown in red:
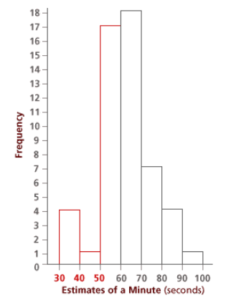
These three representations tell us that there are 22 estimates below 60.
Problem C3
Complete this cumulative frequency table with the information you collected from the histograms above:
Problem C4
Use only the cumulative frequencies from the table to answer the questions below. As with Problem C1, first determine whether a question can be answered using only this table.
a. How many responses are in the 70s and below?
b. How many responses are 80 or higher?
c. How many responses are in the 50s and below?
d. How many responses are 60 or higher
e. How many responses are less than 100?
f. How many responses are at least 40 but below 70?
g. How many responses are 65 or greater?
h. How many responses are less than 35?
i. How many responses are equal to 60?
In This Part: Relative Cumulative Frequencies
You can convert cumulative frequencies to relative cumulative frequencies by dividing each cumulative frequency by the total number of data values. For the 52 estimates of a minute, here are the relative cumulative frequencies:
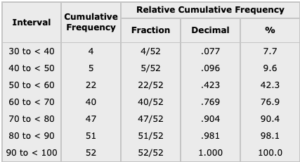
Problem C5
Use only the relative cumulative frequencies from this table to answer the questions below. This time, give your answers in percentages, to the nearest tenth of a percent.
a. What percentage of the responses are in the 70s and below?
b. What percentage of the responses are 80 or higher?
c. What percentage of the responses are in the 50s and below?
d. What percentage of the responses are 60 or higher?
e. What percentage of the responses are less than 100?
f. What percentage of the responses are at least 40 but below 70?
Notes
Note 4
Cumulative frequencies and relative cumulative frequencies are introduced in Part C, using all three representations — the line plot, the stem and leaf plot, and the histogram. Again, seeing this idea in the different representations not only reinforces what you learn about the data set, but also emphasizes the relationships between the different representations.
Solutions
Problem C1
a. Adding the percentages shows us that 90.4% of the responses are in the 70s and below.
b. Adding the percentages shows us that 9.6% are 80 or higher.
c. Adding the percentages shows us that 42.3% are in the 50s and below.
d. Adding the percentages shows us that 57.7% are 60 or higher.
e. All of them (100%) are less than 100.
f. Adding the percentages shows us that 69.2% are at least 40 but below 70.
g. This question cannot be answered using only this relative frequency table, since we are not told how many responses are in the interval 65 to < 70; we only know how many are in the interval 60 to <70.
h. This question cannot be answered using only this relative frequency table, since we do not know how many responses are in the interval 30 to < 35.
i. This question cannot be answered using only this relative frequency table, since we do not know how many responses are exactly 60 — only that 34.6% are in the interval 60 to < 70.
Problem C2
For questions (g) and (h), we might guess that half the responses will be in the lower range (60-64 and 30-34) and the other half will be in the upper range (65-69 and 35-39).
For question (g), we know that 23.1% of the responses are 70 or above and 34.6% are in the interval 60 to < 70. Half of 34.6% is 17.3%, which gives us an estimate of 23.1% + 17.3% = 40.4% for the percentage of responses that are 65 or greater.
For question (h), we know that 7.7% of the responses are in the interval 30 to < 40. Half of this is 3.85% (or 3.9%), which is our estimate for the percentage of responses less than 35.
Problem C3

Problem C4
a. Forty-seven responses are in the 70s and below.
b. Five responses are 80 or higher (52 – 47).
c. Twenty-two responses are in the 50s and below.
d. Thirty responses are 60 or higher (52 – 22).
e. All 52 responses are less than 100.
f. Thirty-six responses are at least 40 but less than 70 (40 – 4).
Questions (g), (h), and (i) cannot be answered because the table only gives answers in intervals of 10, and these questions ask about smaller intervals.
ProblemC5
a. Using only the relative cumulative frequencies, 90.4% of the responses are in the 70s and below.
b. Using only the relative cumulative frequencies, 9.6% of the responses are 80 or higher (100 – 90.4).
c. Using only the relative cumulative frequencies, 42.3% of the responses are in the 50s and below.
d. Using only the relative cumulative frequencies, 57.7% of the responses are 60 or higher (100 – 42.3).
e. All of the responses (100%) are less than 100.
f. Using only the relative cumulative frequencies, 69.2% of the responses are at least 40 but less than 70 (76.9 – 7.7).