Tools of the Simulator
Simulator Controls

- Reset
- Returns the simulator to Day 0.
- Pause
- Interrupt a Run.
- Step
- Advance the simulator one day.
- Run
- Run the simulator to day 100.
Simulation Parameters
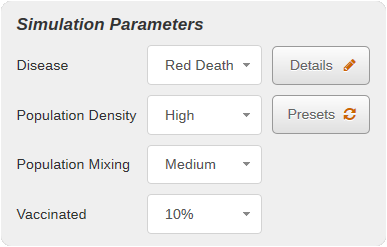
- Disease
- A pull-down menu that lists diseases to explore: Kold, Impfluenza, Neasles, and Red Death.
Though the disease names are evocative of real diseases, they are
simplified caricatures, hence the cartoon names.
-
- Details
- The Details button allows you to examine and change the parameters
of the current disease. (See below.)
- Presets
- The Presets button restores pull-down selections to the defaults for the current Lesson.
- Population Density
- A pull-down menu to select how crowded and populated the population display
area will be.
There are three options: Low for 200 initial population,
Medium for 600, and High for 900.
- Population Mixing
- A pull-down menu to select how often contagious people infect
others at a distance, beyond their immediate neighbors.
There are four options for Population Mixing:
-
- None—contagion only passes to
immediate neighbors
- Low—rare distance interactions
- Medium—moderate interaction in the community
- High—contagion can pass throughout the community
- Vaccinated
- If available for the current Lesson, Vaccination is a pull-down
menu to select what percentage of the population is already immune to the disease
on day 0, when simulation begins.
Disease Details
Click the Details button to the right of the Disease pull-down to open the
Disease Details dialog.
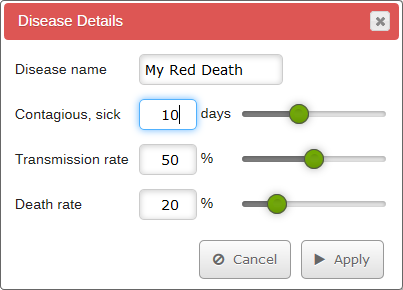
- Disease Name
- The name for your custom disease if you make any changes. The dialog won't
change the preset 4 diseases, but rather add your new disease to the pull-down list.
- Contagious, sick
- Use the slider or text entry box to set the number of days
a sick individual will remain sick and be contagious to others. There is no incubation
period.
- Transmission rate
- This is the probability that an “at-risk” person (not immune) will catch
a disease when exposed to it. Exposure comes from either a sick neighbor
or a long-range interaction from a sick non-neighbor (population mixing).
This probability is per day, so if a neighbor is sick for 5 days, the person has
5 chances at this rate to catch the disease.
Use the slider or text entry box to set the rate.
- Death rate
- Use the slider or text entry box to set the probability that an individual will die
as a result of the illness. Death happens on the last day of illness—a sick
person either
gets well (and immune) or dies after the set number of sick days.
Population Immunity Graph
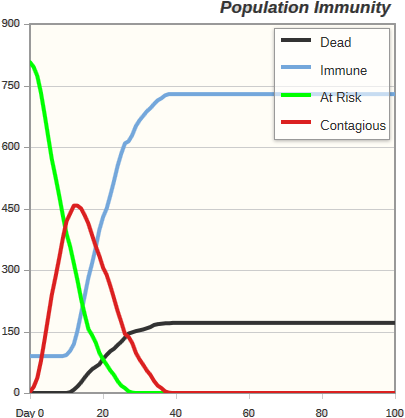
This graph shows the simulator progress over time. The y-axis is population and the x-axis is
the day. Four lines appear on the graph. You can mouse over (or tap) a point on the line to get a tooltip giving the
line's value at that point. On the graph legend, you can click a line's name to turn
the line on or off.
- Contagious
- The number of people who are sick and contagious.
- Immune
- People who were either vaccinated on day 0, or got sick and got better. Immune
people cannot catch or transmit the disease.
- At Risk
- People who can still get sick if exposed.
- Dead
- People who have died as a result of the disease.
Vital Statistics
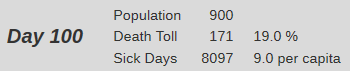
- Day
- Current day in the simulator's 100-day Run.
- Population
- The starting number of people within the scenario.
- Sick Days
- The total number of sick days taken for the entire population. The number per capita
is the number of sick days divided by the population.
- Death Toll
- The total number of people in the population who have died as a result of the disease.
The percentage next to Death Toll tells you the percentage of the total population that
died of the disease. Note that dead individuals are removed from the population display.
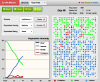
Population Display
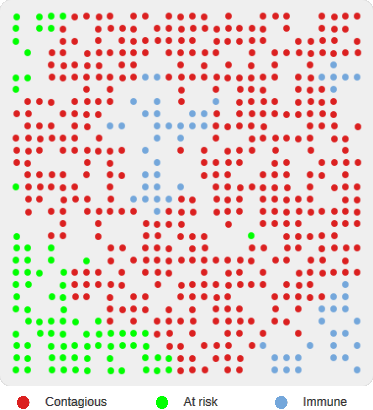
Each dot represents an individual. The color legend is at the bottom of the display.
Contagious is red,
Immune is blue, and At Risk is green. The dead are removed
from the field as they expire. Immune dots do not wiggle, to show that they are not
involved in disease propagation.