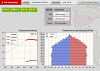
Lessons > Population Momentum > Step 2Now let's look at Japan, a country with a population structure almost the opposite to that of Nigeria. Make a prediction about how this difference in population structure might affect the growth of the population, given what you know about the ages at which people are able to bear children and the ages at which people are likely to die. Apply the process laid out in Step 1 to Japan. Select Japan from the Country pull down menu, run the simulator with the default settings to 2050, and record the results in your Data Table. Predict what will happen when the average age of childbearing women is increased by 5 years (fewer teenage pregnancies) and record your prediction. Run the simulator, increasing the childbearing age by 5 years, then 15 years, and then decreasing it by 5 years, and record your results. Remember to Reset between each treatment. Return to the simulator and change the birth and death rates to those of the USA. Again, run the simulator to year 2150, observing what happens to Japan's population pyramid.
|