Tools of the Simulator
Simulator Controls
- Reset Button
- Rewinds to beginning year. Does not re-establish original simulation parameters.
For that, first select a different Lesson on the top bar, then re-select the current Lesson. Or reload the browser window.
- Run Decade
- Simulates the progress of the carbon cycle at its current settings for ten years.
Simulator Parameters
- Change in fossil fuel use per year
- Use your mouse to move the white circle knob,
to set the percent change in fossil fuel use per year. Moving to the left decreases the rate and moving to the right increases it.
- Note: You are increasing or decreasing fossil fuel use, not energy use. Energy use could rise while fossil fuel use falls,
if energy generation changed from fossil fuels to some other form (wind, solar, biofuel, etc).
- Deforestation rate per year
- Use your mouse to move the white circle knob,
to set the rate of deforestation per year. Note that deforestation is expressed as GT (metric gigatons) of carbon released, not as a percentage rate of increase. Realistic deforestation rates would remain less than 2 GT per year.
- NONE
- Clicking on this button sets fossil fuel use to zero,
meaning that all energy, worldwide, suddenly switches to some energy source other than fossil fuels.
- Note: NONE is different than a rate of increase of 0, in which fossil fuel use stops increasing.
- Year and numbers
-
The year tells you where you are in the progression of the simulation. Simulation begins with year 2010. The amount of carbon released from fossil fuels in the current year is listed below the year in gigatons, which is abbreviated as GT.
Carbon released for a decade is shown on the smokestack.
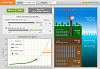
Graph
The Atmospheric CO2 graph shows the progression of the carbon cycle and the amount of
atmospheric carbon per year in parts per million, abbreviated as ppm. One part per million (ppm) means that for
every million molecules in the air, one is carbon dioxide.
There are four lines on the graph: Historical, Projected, Simulated, and Goal.
There is a diamond marker to highlight "Now". Each of these
can be turned off by clicking their name in the legend.
- Projected
- This line comes from the IPCC (International Panel on Climate Change) 2013 Climate Change report
(brief summary).
The line shows the "business as usual" projection RCP8.5 for how atmospheric carbon would
likely develop in the future. The simulation doesn't affect this line. It is included as a reference.
- Simulated
- This line shows atmospheric carbon dioxide calculated by running the simulator.
As you change parameters, the slope and general shape of this line will change as well.
This line is directly correlated to the carbon cycle illustration, and tracks the number in the middle of the sky on the
right hand side, which says XXX ppm CO2.
- Now
- The diamond at the end of the Simulated CO2 line highlights the current simulator status.
- Goal
- This line refers to the goal of 550 ppm CO2, which would be twice the amount of atmospheric carbon in
comparison to pre-industrial levels. The IPCC established this number as a goal in the 1990's,
hoping that carbon emissions can be stabilized at this number instead of continually rising as they have done
since the advent of the Industrial Revolution. That goal seeks to limit world warming to 2°C.
Simulator Illustration
All numbers refer to the amount of carbon present in that area. The plus or minus numbers show the change
from the original value (in 2010). The scale is at the bottom: one grey rectangle equals 25 gigatons (GT) of carbon.
Carbon cycles in this illustration through a rough arc. Fossil fuels rise through the smokestack, into
the atmosphere, and down to terrestrial plants and soil and ocean surface. From the ocean surface carbon gradually flows to the deep ocean.
- The smokestack number
- This number represents the
human-generated fossil carbon emissions (in gigatons) released in the last decade time step.
- XXX ppm CO2
- This number represents the current atmospheric carbon dioxide,
based on the simulation. This number is also plotted on the Simulated CO2 line
of the graph as the simulator runs.